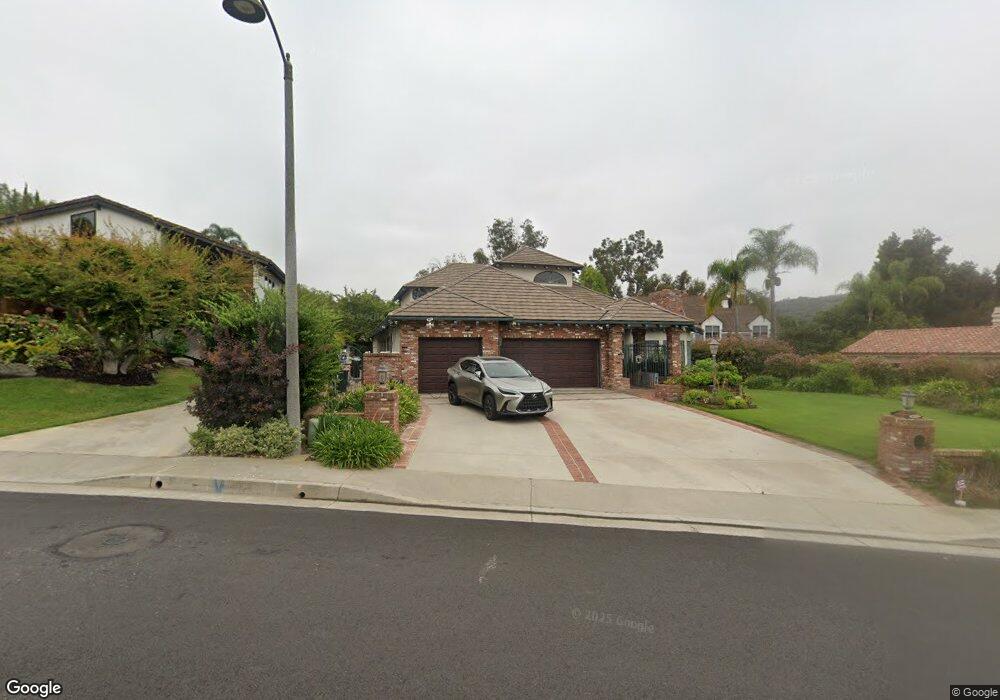
27702 Horseshoe Bend San Juan Capistrano, CA 92675
Estimated Value: $2,850,000 - $3,207,000
4
Beds
4
Baths
4,258
Sq Ft
$720/Sq Ft
Est. Value
About This Home
This home is located at 27702 Horseshoe Bend, San Juan Capistrano, CA 92675 and is currently estimated at $3,065,899, approximately $720 per square foot. 27702 Horseshoe Bend is a home located in Orange County with nearby schools including Harold Ambuehl Elementary School, Marco Forster Middle School, and San Juan Hills High School.
Ownership History
Date
Name
Owned For
Owner Type
Purchase Details
Closed on
Apr 3, 2012
Sold by
Ehrke Roxanne L
Bought by
Ehrke Roxanne L and The Ehrke Living Trust
Current Estimated Value
Purchase Details
Closed on
Nov 17, 2003
Sold by
Ehrke Albert F and Ehrke Roxanne L
Bought by
Ehrke Albert F and Ehrke Roxanne L
Purchase Details
Closed on
Sep 19, 2000
Sold by
James Fischer B and James Joyce A
Bought by
Ehrke Albert F and Ehrke Roxanne L
Home Financials for this Owner
Home Financials are based on the most recent Mortgage that was taken out on this home.
Original Mortgage
$699,950
Interest Rate
7.88%
Create a Home Valuation Report for This Property
The Home Valuation Report is an in-depth analysis detailing your home's value as well as a comparison with similar homes in the area
Home Values in the Area
Average Home Value in this Area
Purchase History
| Date | Buyer | Sale Price | Title Company |
|---|---|---|---|
| Ehrke Roxanne L | -- | None Available | |
| Ehrke Albert F | -- | -- | |
| Ehrke Albert F | $1,154,000 | -- |
Source: Public Records
Mortgage History
| Date | Status | Borrower | Loan Amount |
|---|---|---|---|
| Previous Owner | Ehrke Albert F | $699,950 | |
| Closed | Ehrke Albert F | $165,500 |
Source: Public Records
Tax History Compared to Growth
Tax History
| Year | Tax Paid | Tax Assessment Tax Assessment Total Assessment is a certain percentage of the fair market value that is determined by local assessors to be the total taxable value of land and additions on the property. | Land | Improvement |
|---|---|---|---|---|
| 2025 | $17,827 | $1,738,897 | $1,135,543 | $603,354 |
| 2024 | $17,827 | $1,704,801 | $1,113,277 | $591,524 |
| 2023 | $17,404 | $1,671,374 | $1,091,448 | $579,926 |
| 2022 | $16,819 | $1,638,602 | $1,070,047 | $568,555 |
| 2021 | $16,508 | $1,606,473 | $1,049,066 | $557,407 |
| 2020 | $16,361 | $1,590,001 | $1,038,309 | $551,692 |
| 2019 | $16,057 | $1,558,825 | $1,017,950 | $540,875 |
| 2018 | $15,768 | $1,528,260 | $997,990 | $530,270 |
| 2017 | $15,623 | $1,498,295 | $978,422 | $519,873 |
| 2016 | $15,335 | $1,468,917 | $959,237 | $509,680 |
| 2015 | $15,101 | $1,446,853 | $944,828 | $502,025 |
| 2014 | $14,833 | $1,418,512 | $926,320 | $492,192 |
Source: Public Records
Map
Nearby Homes
- 27821 Golden Ridge Ln
- 30431 Via Festivo
- 27972 Golden Ridge Ln
- 30372 Marbella Vista
- 27971 Golden Ridge Ln
- 27281 Viewpoint Cir
- 27591 Rolling Wood Ln
- 1 David St
- 30532 Marbella Vista
- 10 Strawberry Ln
- 15 Pisano St
- 10 Gaucho Rd
- 4 Gaucho Rd
- 27946 Suffolk Ln
- 1 Cambridge Rd
- 27962 Suffolk Ln
- 27703 Ortega Hwy Unit 13
- 27703 Ortega Hwy Unit 127
- 30932 Steeplechase Dr
- 6 Pistoria Ln
- 27712 Horseshoe Bend
- 27692 Horseshoe Bend
- 27682 Horseshoe Bend
- 27711 Horseshoe Bend
- 27701 Horseshoe Bend
- 30231 Via Festivo
- 27721 Horseshoe Bend
- 27681 Horseshoe Bend
- 30221 Via Festivo
- 30241 Via Festivo
- 27741 Horseshoe Bend
- 30211 Via Festivo
- 30251 Via Festivo
- 27751 Horseshoe Bend
- 30261 Via Festivo
- 30201 Via Festivo
- 30191 Hillside Terrace
- 30193 Hillside Terrace
- 30195 Hillside Terrace
- 30271 Via Festivo