Estimated Value: $302,478 - $380,000
3
Beds
1
Bath
1,852
Sq Ft
$190/Sq Ft
Est. Value
About This Home
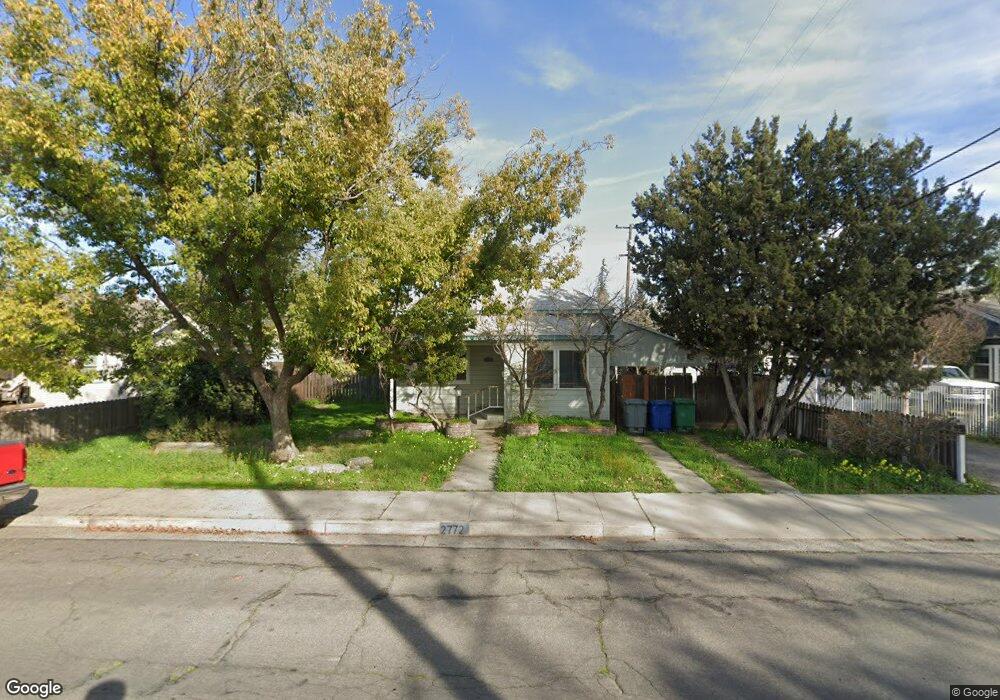
This home is located at 2772 Logan St, Selma, CA 93662 and is currently estimated at $351,159, approximately $189 per square foot. 2772 Logan St is a home located in Fresno County with nearby schools including Theodore Roosevelt Elementary School, Abraham Lincoln Middle School, and Selma High School.
Ownership History
Date
Name
Owned For
Owner Type
Purchase Details
Closed on
Apr 8, 2015
Sold by
Mankin Oiela
Bought by
Morris Linda Kulla and Townsend Gregory David Mankin
Current Estimated Value
Purchase Details
Closed on
Apr 5, 2007
Sold by
Mankin Oiela
Bought by
Mankin Oiela
Home Financials for this Owner
Home Financials are based on the most recent Mortgage that was taken out on this home.
Original Mortgage
$125,000
Interest Rate
6.13%
Mortgage Type
New Conventional
Purchase Details
Closed on
Aug 28, 2003
Sold by
Mankin Leonid
Bought by
Mankin Oiela
Create a Home Valuation Report for This Property
The Home Valuation Report is an in-depth analysis detailing your home's value as well as a comparison with similar homes in the area
Home Values in the Area
Average Home Value in this Area
Purchase History
| Date | Buyer | Sale Price | Title Company |
|---|---|---|---|
| Morris Linda Kulla | -- | None Available | |
| Mankin Oiela | -- | Financial Title Company | |
| Mankin Oiela | -- | -- |
Source: Public Records
Mortgage History
| Date | Status | Borrower | Loan Amount |
|---|---|---|---|
| Previous Owner | Mankin Oiela | $125,000 |
Source: Public Records
Tax History
| Year | Tax Paid | Tax Assessment Tax Assessment Total Assessment is a certain percentage of the fair market value that is determined by local assessors to be the total taxable value of land and additions on the property. | Land | Improvement |
|---|---|---|---|---|
| 2025 | $1,500 | $47,061 | $11,750 | $35,311 |
| 2023 | $991 | $45,236 | $11,295 | $33,941 |
| 2022 | $943 | $44,350 | $11,074 | $33,276 |
| 2021 | $916 | $43,481 | $10,857 | $32,624 |
| 2020 | $898 | $43,036 | $10,746 | $32,290 |
| 2019 | $870 | $42,193 | $10,536 | $31,657 |
| 2018 | $848 | $41,367 | $10,330 | $31,037 |
| 2017 | $783 | $40,557 | $10,128 | $30,429 |
| 2016 | $689 | $39,763 | $9,930 | $29,833 |
| 2015 | $693 | $39,166 | $9,781 | $29,385 |
| 2014 | $665 | $38,400 | $9,590 | $28,810 |
Source: Public Records
Map
Nearby Homes
- 2002 Merced St
- 12623 S Mccall Ave
- 2629 Mccall Ave
- 2221 Floral Ave
- 2226 Arrants St
- 2850 Mccall Ave Unit A-F
- 2841 C St
- 0 Rose Ave
- 2753 Thompson Ave
- 2510 Whitson St
- 2019 Oak St
- 1517 Stillman St
- 2561 Stillman St Unit 111
- 2020 Aspen St
- 2772 Valley View St
- 2591 Rose Ave
- 2222 Barbara St
- 1607 Cooper St
- 3239 Lee St
- 2546 Evergreen St
Your Personal Tour Guide
Ask me questions while you tour the home.