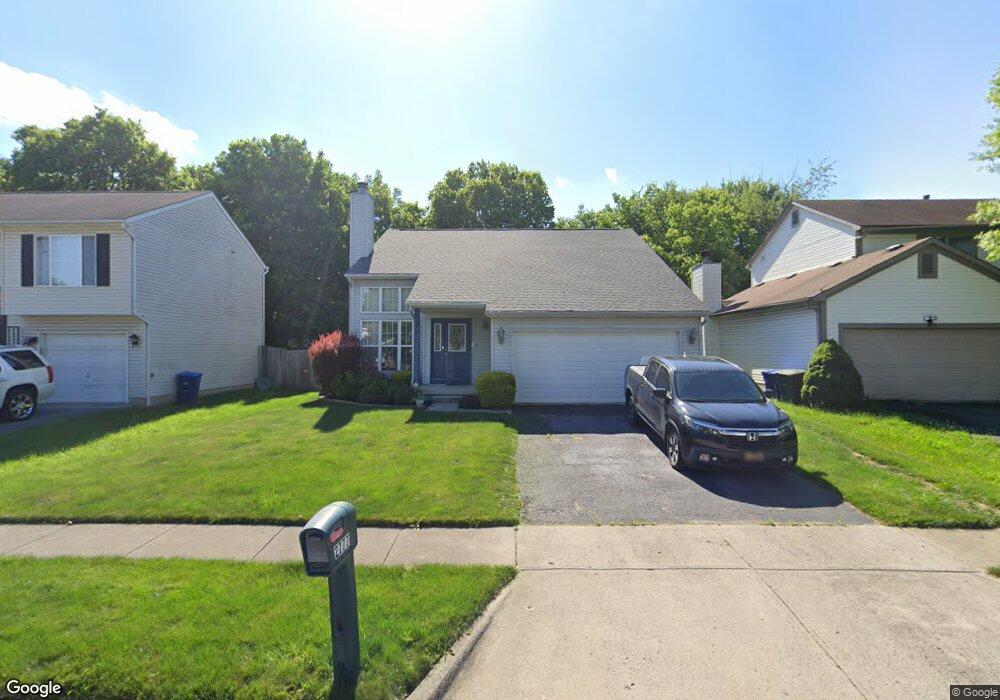
2777 Raphael Dr Columbus, OH 43232
Walnut Heights NeighborhoodEstimated Value: $260,550 - $298,000
3
Beds
2
Baths
1,572
Sq Ft
$179/Sq Ft
Est. Value
About This Home
This home is located at 2777 Raphael Dr, Columbus, OH 43232 and is currently estimated at $281,138, approximately $178 per square foot. 2777 Raphael Dr is a home located in Franklin County with nearby schools including Liberty Elementary School, Yorktown Middle School, and Independence High School.
Ownership History
Date
Name
Owned For
Owner Type
Purchase Details
Closed on
Feb 26, 2009
Sold by
Clearly Valued Llc
Bought by
Jackson Vanessa R
Current Estimated Value
Home Financials for this Owner
Home Financials are based on the most recent Mortgage that was taken out on this home.
Original Mortgage
$111,823
Outstanding Balance
$69,913
Interest Rate
5.14%
Mortgage Type
FHA
Estimated Equity
$211,225
Purchase Details
Closed on
Jun 19, 2008
Sold by
Us Bank Na
Bought by
Clearly Valued Llc
Purchase Details
Closed on
May 14, 2008
Sold by
Willis Keith M and Case #07Cve10 14224
Bought by
Us Bank Na and First Franklin Mortgage Loan Trust 2006-
Purchase Details
Closed on
Jan 27, 1995
Sold by
Columbus Contractor Co
Bought by
Keith M Willis
Home Financials for this Owner
Home Financials are based on the most recent Mortgage that was taken out on this home.
Original Mortgage
$84,500
Interest Rate
9.28%
Mortgage Type
New Conventional
Create a Home Valuation Report for This Property
The Home Valuation Report is an in-depth analysis detailing your home's value as well as a comparison with similar homes in the area
Home Values in the Area
Average Home Value in this Area
Purchase History
| Date | Buyer | Sale Price | Title Company |
|---|---|---|---|
| Jackson Vanessa R | $112,900 | Chicago Tit | |
| Clearly Valued Llc | $35,600 | Prism Title & Closing Servic | |
| Us Bank Na | $95,400 | None Available | |
| Keith M Willis | $105,671 | -- |
Source: Public Records
Mortgage History
| Date | Status | Borrower | Loan Amount |
|---|---|---|---|
| Open | Jackson Vanessa R | $111,823 | |
| Previous Owner | Keith M Willis | $84,500 |
Source: Public Records
Tax History
| Year | Tax Paid | Tax Assessment Tax Assessment Total Assessment is a certain percentage of the fair market value that is determined by local assessors to be the total taxable value of land and additions on the property. | Land | Improvement |
|---|---|---|---|---|
| 2025 | $3,681 | $82,010 | $16,980 | $65,030 |
| 2024 | $3,681 | $82,010 | $16,980 | $65,030 |
| 2023 | $3,634 | $82,005 | $16,975 | $65,030 |
| 2022 | $2,541 | $49,000 | $5,250 | $43,750 |
| 2021 | $2,546 | $49,000 | $5,250 | $43,750 |
| 2020 | $2,549 | $49,000 | $5,250 | $43,750 |
| 2019 | $2,476 | $40,820 | $4,380 | $36,440 |
| 2018 | $2,189 | $40,820 | $4,380 | $36,440 |
| 2017 | $2,288 | $40,820 | $4,380 | $36,440 |
| 2016 | $2,101 | $31,710 | $6,020 | $25,690 |
| 2015 | $1,907 | $31,710 | $6,020 | $25,690 |
| 2014 | $1,912 | $31,710 | $6,020 | $25,690 |
| 2013 | $1,047 | $35,210 | $6,685 | $28,525 |
Source: Public Records
Map
Nearby Homes
- 2737 Raphael Dr
- 2730 Raphael Dr
- 2744 Barrows Rd
- 2736 Barrows Rd
- 2700 Raphael Dr
- 2706 Moundcrest St
- 5326 Adderley Ave
- 5278 Glenbriar Ct
- 5414 Paladim Rd
- 2900 Gentry Ln
- 2651 Brownfield Rd
- 2608 Hubbell Rd
- 5373 Spire Ln
- 5137 Holbrook Dr
- 5290 Quincy Dr
- 3057 Lamptonridge Dr
- 5882 Abernathy Ln Unit 5882F
- 2998 Osgood Rd E
- 5944 Abernathy Ln
- 5946 Abernathy Ln
- 2771 Raphael Dr
- 2783 Raphael Dr
- 2765 Raphael Dr
- 2789 Raphael Dr
- 2788 Millvale St
- 2780 Millvale St
- 2796 Millvale St
- 2772 Millvale St
- 2759 Raphael Dr
- 2778 Raphael Dr
- 2795 Raphael Dr
- 2772 Raphael Dr
- 2784 Raphael Dr
- 2802 Millvale St
- 2766 Raphael Dr
- 5429 Monfort Ave
- 2790 Raphael Dr
- 2801 Raphael Dr
- 2760 Raphael Dr
- 2808 Millvale St
Your Personal Tour Guide
Ask me questions while you tour the home.