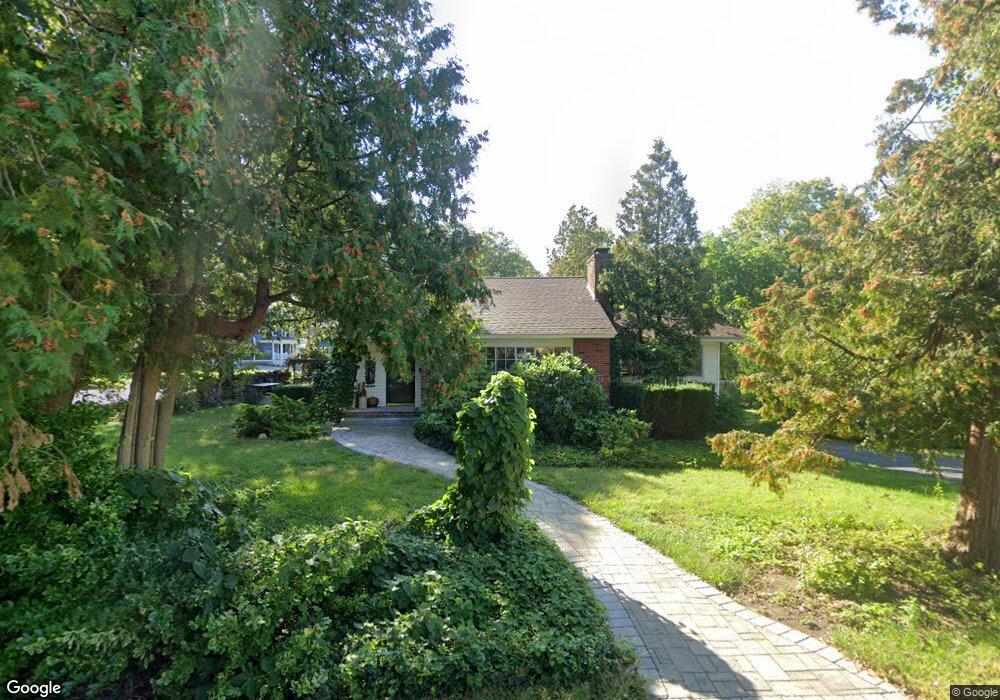
28 Foster Cir Unit 1 Andover, MA 01810
East Andover NeighborhoodEstimated Value: $874,221 - $1,047,000
2
Beds
2
Baths
2,110
Sq Ft
$441/Sq Ft
Est. Value
About This Home
This home is located at 28 Foster Cir Unit 1, Andover, MA 01810 and is currently estimated at $931,305, approximately $441 per square foot. 28 Foster Cir Unit 1 is a home located in Essex County with nearby schools including Bancroft Elementary School, Doherty Middle School, and Andover High School.
Ownership History
Date
Name
Owned For
Owner Type
Purchase Details
Closed on
Jun 18, 2019
Sold by
Defusco-Perkins Emily
Bought by
H R Jr & E R Perkins Ft and Perkins
Current Estimated Value
Purchase Details
Closed on
Feb 11, 1993
Sold by
Darby Carlene E
Bought by
Perkins Emily Defusco
Home Financials for this Owner
Home Financials are based on the most recent Mortgage that was taken out on this home.
Original Mortgage
$165,150
Interest Rate
8.13%
Mortgage Type
Purchase Money Mortgage
Create a Home Valuation Report for This Property
The Home Valuation Report is an in-depth analysis detailing your home's value as well as a comparison with similar homes in the area
Home Values in the Area
Average Home Value in this Area
Purchase History
| Date | Buyer | Sale Price | Title Company |
|---|---|---|---|
| H R Jr & E R Perkins Ft | -- | -- | |
| H R Jr & E R Perkins Ft | -- | -- | |
| Perkins Emily Defusco | $183,500 | -- | |
| Perkins Emily Defusco | $183,500 | -- |
Source: Public Records
Mortgage History
| Date | Status | Borrower | Loan Amount |
|---|---|---|---|
| Previous Owner | Perkins Emily Defusco | $203,500 | |
| Previous Owner | Perkins Emily Defusco | $165,150 |
Source: Public Records
Tax History Compared to Growth
Tax History
| Year | Tax Paid | Tax Assessment Tax Assessment Total Assessment is a certain percentage of the fair market value that is determined by local assessors to be the total taxable value of land and additions on the property. | Land | Improvement |
|---|---|---|---|---|
| 2024 | $9,677 | $751,300 | $504,200 | $247,100 |
| 2023 | $9,241 | $676,500 | $454,100 | $222,400 |
| 2022 | $8,658 | $593,000 | $401,900 | $191,100 |
| 2021 | $8,264 | $540,500 | $365,400 | $175,100 |
| 2020 | $7,921 | $527,700 | $356,500 | $171,200 |
| 2019 | $7,365 | $482,300 | $315,700 | $166,600 |
| 2018 | $7,051 | $450,800 | $297,900 | $152,900 |
| 2017 | $6,734 | $443,600 | $292,100 | $151,500 |
| 2016 | $6,294 | $424,700 | $273,200 | $151,500 |
| 2015 | $6,069 | $405,400 | $262,800 | $142,600 |
Source: Public Records
Map
Nearby Homes
- 61 Elm St Unit 61
- 105 Elm St Unit A
- 10 Maple Ave Unit 3
- 20 Walnut Ave
- Lot 7 Weeping Willow Dr
- 32 Lucerne Dr
- 9 Chapman Ave
- 2 Powder Mill Square Unit 2B
- 42 Stevens St
- 204 Chestnut St
- 156 High St
- 5 Castle Heights Rd
- 1 Longwood Dr Unit 105
- 38 Lincoln Cir E
- 47 Abbot St
- 170 Haverhill St Unit 138
- 103 Central St
- 53 Salem St
- 105 Central St
- 24 York St