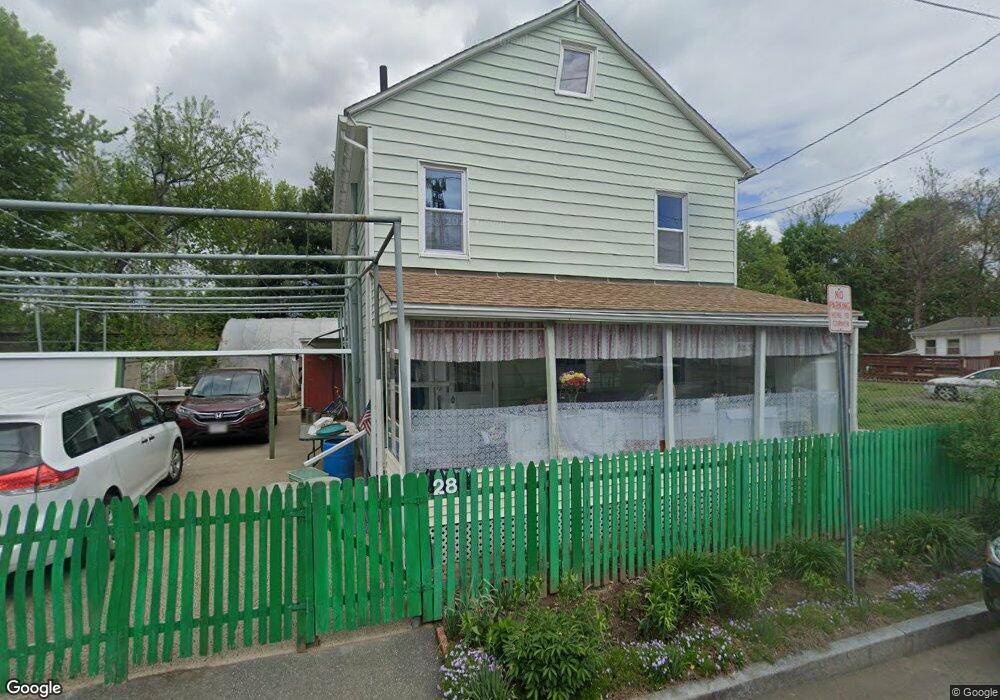
28 Globe St West Springfield, MA 01089
Estimated Value: $267,258 - $379,000
4
Beds
2
Baths
1,386
Sq Ft
$233/Sq Ft
Est. Value
About This Home
This home is located at 28 Globe St, West Springfield, MA 01089 and is currently estimated at $322,815, approximately $232 per square foot. 28 Globe St is a home located in Hampden County with nearby schools including West Springfield High School, Hampden Charter School of Science West, and Libertas Academy Charter School.
Ownership History
Date
Name
Owned For
Owner Type
Purchase Details
Closed on
May 31, 2002
Sold by
Okhrimenko Mikhail I and Okhrimenko Lyudmila
Bought by
Mudrenko Mikhail
Current Estimated Value
Home Financials for this Owner
Home Financials are based on the most recent Mortgage that was taken out on this home.
Original Mortgage
$55,000
Outstanding Balance
$23,567
Interest Rate
7%
Mortgage Type
Purchase Money Mortgage
Estimated Equity
$299,248
Purchase Details
Closed on
Feb 4, 1998
Sold by
Cirillo Rlty Inc
Bought by
Zayats Yaroslav and Shevchenko Vladimir
Purchase Details
Closed on
Mar 28, 1995
Sold by
Perry Floyd and Perry Beverly
Bought by
Cirillo Rlty Inc
Purchase Details
Closed on
Dec 28, 1989
Sold by
Cable Russell T
Bought by
Perry Floyd
Purchase Details
Closed on
Jun 30, 1989
Sold by
Hutchinson Donald
Bought by
Cable Russell T
Create a Home Valuation Report for This Property
The Home Valuation Report is an in-depth analysis detailing your home's value as well as a comparison with similar homes in the area
Home Values in the Area
Average Home Value in this Area
Purchase History
| Date | Buyer | Sale Price | Title Company |
|---|---|---|---|
| Mudrenko Mikhail | $90,000 | -- | |
| Zayats Yaroslav | $44,166 | -- | |
| Cirillo Rlty Inc | $12,000 | -- | |
| Perry Floyd | $95,000 | -- | |
| Cable Russell T | $52,000 | -- |
Source: Public Records
Mortgage History
| Date | Status | Borrower | Loan Amount |
|---|---|---|---|
| Open | Cable Russell T | $55,000 | |
| Previous Owner | Cable Russell T | $9,000 | |
| Previous Owner | Cable Russell T | $43,572 |
Source: Public Records
Tax History
| Year | Tax Paid | Tax Assessment Tax Assessment Total Assessment is a certain percentage of the fair market value that is determined by local assessors to be the total taxable value of land and additions on the property. | Land | Improvement |
|---|---|---|---|---|
| 2025 | $2,946 | $198,100 | $84,500 | $113,600 |
| 2024 | $2,934 | $198,100 | $84,500 | $113,600 |
| 2023 | $2,785 | $179,200 | $84,500 | $94,700 |
| 2022 | $2,701 | $171,400 | $76,700 | $94,700 |
| 2021 | $2,192 | $129,700 | $61,000 | $68,700 |
| 2020 | $2,197 | $129,300 | $61,000 | $68,300 |
| 2019 | $2,193 | $129,300 | $61,000 | $68,300 |
| 2018 | $2,205 | $129,300 | $61,000 | $68,300 |
| 2017 | $2,205 | $129,300 | $61,000 | $68,300 |
| 2016 | $2,158 | $127,000 | $58,700 | $68,300 |
| 2015 | $2,063 | $121,400 | $57,500 | $63,900 |
| 2014 | $499 | $121,400 | $57,500 | $63,900 |
Source: Public Records
Map
Nearby Homes
- 20 E School St
- 31 Russell St
- 20 Sprague St
- 20 Cottage St
- 37 Day St
- 140 Chestnut St Unit 706
- 140 Chestnut St Unit 702
- 140 Chestnut St Unit 204
- 140 Chestnut St Unit 819
- 140 Chestnut St Unit 619
- 140 Chestnut St Unit 816
- 140 Chestnut St Unit 604
- 140 Chestnut St Unit 407
- 29 Lowell Ave
- 63 Worcester St
- 0 Maple St
- 69 Winter St
- 146 Union St
- 13 Ringgold St
- 188 Windsor St
Your Personal Tour Guide
Ask me questions while you tour the home.