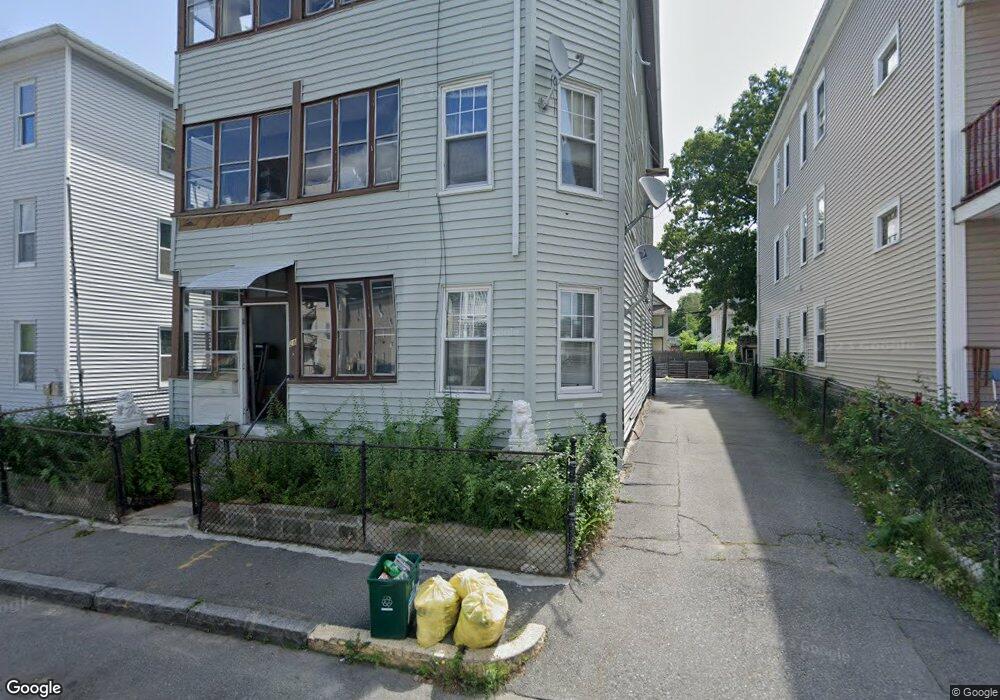
28 Hacker St Worcester, MA 01603
South Worcester NeighborhoodEstimated Value: $406,000 - $740,000
9
Beds
3
Baths
2,958
Sq Ft
$201/Sq Ft
Est. Value
About This Home
This home is located at 28 Hacker St, Worcester, MA 01603 and is currently estimated at $594,333, approximately $200 per square foot. 28 Hacker St is a home located in Worcester County with nearby schools including Jacob Hiatt Magnet School, Chandler Magnet, and University Park Campus School.
Ownership History
Date
Name
Owned For
Owner Type
Purchase Details
Closed on
Nov 2, 2024
Sold by
Khuu Henry T
Bought by
28 Hacker Street Rt and Khuu
Current Estimated Value
Purchase Details
Closed on
Jun 13, 2000
Sold by
Ha Phouc Dan
Bought by
Khuu Henry Thao
Home Financials for this Owner
Home Financials are based on the most recent Mortgage that was taken out on this home.
Original Mortgage
$79,968
Interest Rate
8.12%
Mortgage Type
Purchase Money Mortgage
Purchase Details
Closed on
Jun 15, 1994
Sold by
Butrym Stanislaw and Butrym Beverly
Bought by
Ha Phouc
Create a Home Valuation Report for This Property
The Home Valuation Report is an in-depth analysis detailing your home's value as well as a comparison with similar homes in the area
Home Values in the Area
Average Home Value in this Area
Purchase History
| Date | Buyer | Sale Price | Title Company |
|---|---|---|---|
| 28 Hacker Street Rt | -- | None Available | |
| 28 Hacker Street Rt | -- | None Available | |
| Khuu Henry Thao | $98,000 | -- | |
| Khuu Henry Thao | $98,000 | -- | |
| Ha Phouc | $78,000 | -- | |
| Ha Phouc | $78,000 | -- |
Source: Public Records
Mortgage History
| Date | Status | Borrower | Loan Amount |
|---|---|---|---|
| Previous Owner | Ha Phouc | $115,000 | |
| Previous Owner | Ha Phouc | $79,968 |
Source: Public Records
Tax History
| Year | Tax Paid | Tax Assessment Tax Assessment Total Assessment is a certain percentage of the fair market value that is determined by local assessors to be the total taxable value of land and additions on the property. | Land | Improvement |
|---|---|---|---|---|
| 2025 | $6,078 | $460,800 | $45,800 | $415,000 |
| 2024 | $5,565 | $404,700 | $45,800 | $358,900 |
| 2023 | $5,297 | $369,400 | $36,200 | $333,200 |
| 2022 | $4,621 | $303,800 | $29,000 | $274,800 |
| 2021 | $4,042 | $248,300 | $23,200 | $225,100 |
| 2020 | $3,715 | $218,500 | $23,200 | $195,300 |
| 2019 | $3,573 | $198,500 | $22,100 | $176,400 |
| 2018 | $3,487 | $184,400 | $22,100 | $162,300 |
| 2017 | $3,262 | $169,700 | $22,100 | $147,600 |
| 2016 | $3,164 | $153,500 | $15,800 | $137,700 |
| 2015 | $3,081 | $153,500 | $15,800 | $137,700 |
| 2014 | $2,999 | $153,500 | $15,800 | $137,700 |
Source: Public Records
Map
Nearby Homes
Your Personal Tour Guide
Ask me questions while you tour the home.