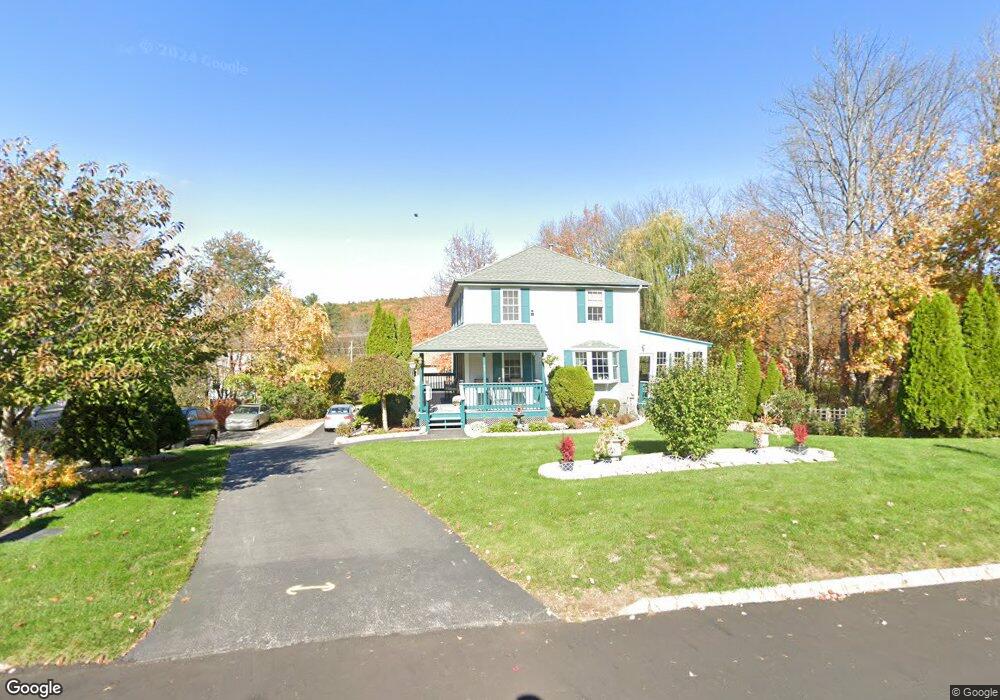
28 Harmony Ln Hooksett, NH 03106
Estimated Value: $539,805 - $666,000
3
Beds
2
Baths
1,728
Sq Ft
$350/Sq Ft
Est. Value
About This Home
This home is located at 28 Harmony Ln, Hooksett, NH 03106 and is currently estimated at $604,451, approximately $349 per square foot. 28 Harmony Ln is a home located in Merrimack County with nearby schools including Fred C. Underhill School, Hooksett Memorial School, and David R. Cawley Middle School.
Ownership History
Date
Name
Owned For
Owner Type
Purchase Details
Closed on
Jan 21, 2009
Sold by
Huff Timothy M and Huff Tara M
Bought by
Vinnacombe Michael P and Vinnacombe Bethann F
Current Estimated Value
Home Financials for this Owner
Home Financials are based on the most recent Mortgage that was taken out on this home.
Original Mortgage
$275,335
Outstanding Balance
$171,742
Interest Rate
5.51%
Mortgage Type
Purchase Money Mortgage
Estimated Equity
$432,709
Purchase Details
Closed on
Nov 1, 2001
Sold by
Culbertson Kenneth D and Culbertson Elizabeth S
Bought by
Huff Timothy M and Huff Tara M
Home Financials for this Owner
Home Financials are based on the most recent Mortgage that was taken out on this home.
Original Mortgage
$181,450
Interest Rate
6.82%
Mortgage Type
Purchase Money Mortgage
Purchase Details
Closed on
Mar 1, 1999
Sold by
Peabody Donald H and Peabody Rita L
Bought by
Culbertson Kenneth D and Culbertson Elizabeth S
Home Financials for this Owner
Home Financials are based on the most recent Mortgage that was taken out on this home.
Original Mortgage
$131,920
Interest Rate
6.78%
Mortgage Type
Purchase Money Mortgage
Purchase Details
Closed on
Oct 5, 1998
Sold by
Harmony Hill Ests Inc
Bought by
Peabody Donald H and Peabody Rita L
Create a Home Valuation Report for This Property
The Home Valuation Report is an in-depth analysis detailing your home's value as well as a comparison with similar homes in the area
Home Values in the Area
Average Home Value in this Area
Purchase History
| Date | Buyer | Sale Price | Title Company |
|---|---|---|---|
| Vinnacombe Michael P | $279,000 | -- | |
| Huff Timothy M | $191,000 | -- | |
| Culbertson Kenneth D | $136,000 | -- | |
| Peabody Donald H | $136,900 | -- |
Source: Public Records
Mortgage History
| Date | Status | Borrower | Loan Amount |
|---|---|---|---|
| Open | Peabody Donald H | $82,562 | |
| Open | Peabody Donald H | $275,335 | |
| Previous Owner | Peabody Donald H | $181,450 | |
| Previous Owner | Peabody Donald H | $131,920 |
Source: Public Records
Tax History
| Year | Tax Paid | Tax Assessment Tax Assessment Total Assessment is a certain percentage of the fair market value that is determined by local assessors to be the total taxable value of land and additions on the property. | Land | Improvement |
|---|---|---|---|---|
| 2025 | $8,696 | $505,900 | $153,000 | $352,900 |
| 2024 | $8,580 | $505,900 | $153,000 | $352,900 |
| 2023 | $8,084 | $505,900 | $153,000 | $352,900 |
| 2022 | $6,679 | $277,700 | $90,800 | $186,900 |
| 2021 | $6,170 | $277,700 | $90,800 | $186,900 |
| 2020 | $6,251 | $277,700 | $90,800 | $186,900 |
| 2019 | $5,984 | $277,700 | $90,800 | $186,900 |
| 2018 | $6,143 | $277,700 | $90,800 | $186,900 |
| 2017 | $5,770 | $215,800 | $78,100 | $137,700 |
| 2016 | $5,695 | $215,800 | $78,100 | $137,700 |
| 2015 | $189 | $215,800 | $78,100 | $137,700 |
| 2014 | $166 | $215,800 | $78,100 | $137,700 |
| 2013 | -- | $215,800 | $78,100 | $137,700 |
Source: Public Records
Map
Nearby Homes
- 267 Londonderry Turnpike
- 8 Lincoln Dr Unit B
- 11 Whitehall Terrace
- 9 Whitehall Terrace
- 10 Virginia Ct
- 32 Lindsay Rd
- 136 Mammoth Rd Unit 26
- 91 Zachary Dr
- 192 Londonderry Turnpike
- 10 Quarry Rd
- 110 Laurel Rd Unit 31
- 199 Whitehall Rd
- 197-199 Whitehall Rd
- 1095 1097 1099 Hooksett Rd Unit 73, 74, 75
- 1099 Hooksett Rd Unit 73
- 1097 Hooksett Rd Unit 74
- 1095 Hooksett Rd
- 36 Prescott Heights Rd
- 16 Hale Ave
- 19 W Stearns Ave
- 26 Harmony Ln
- 43 Whitehall Rd
- 41 Whitehall Rd
- 30 Harmony Ln
- 17 Harmony Ln
- 45 Whitehall Rd
- 15 Harmony Ln
- 24 Harmony Ln
- 32 Harmony Ln
- 44 Whitehall Rd
- 11 Harmony Ln
- 13 Harmony Ln
- 47 Whitehall Rd
- 21 Harmony Ln
- 9 Harmony Ln
- 37 Whitehall Rd
- 37 Whitehall Rd Unit 3
- 37 Whitehall Rd Unit 4
- 299 Londonderry Turnpike
- 7 Harmony Ln
Your Personal Tour Guide
Ask me questions while you tour the home.