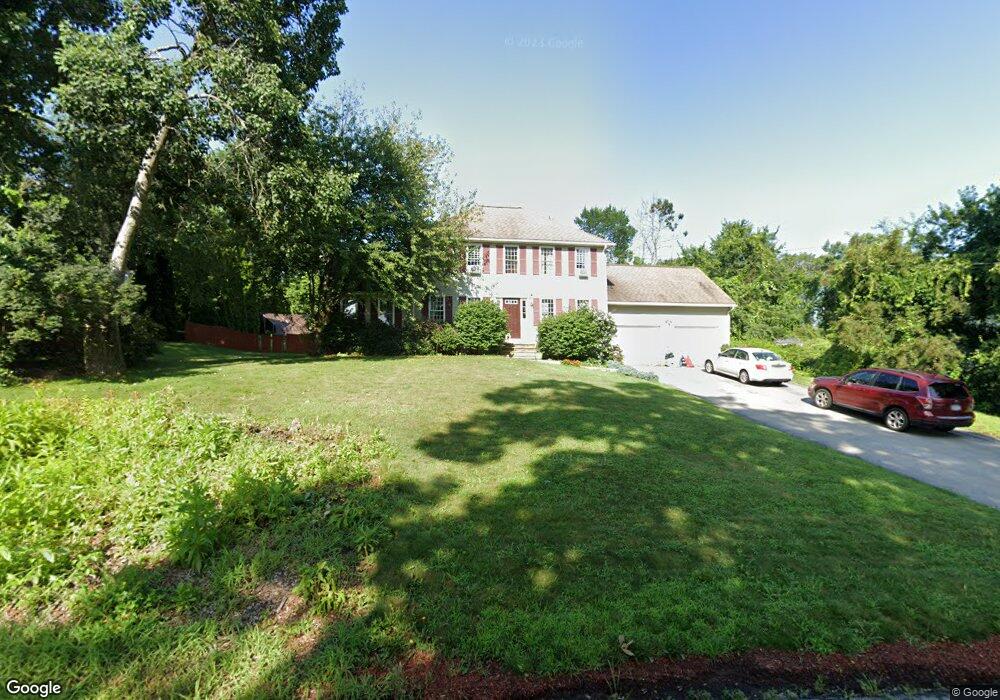
28 Leland Hill Rd Sutton, MA 01590
Estimated Value: $708,000 - $750,000
3
Beds
3
Baths
2,016
Sq Ft
$360/Sq Ft
Est. Value
About This Home
This home is located at 28 Leland Hill Rd, Sutton, MA 01590 and is currently estimated at $726,444, approximately $360 per square foot. 28 Leland Hill Rd is a home located in Worcester County with nearby schools including Sutton Elementary School, Sutton Middle School, and Sutton High School.
Ownership History
Date
Name
Owned For
Owner Type
Purchase Details
Closed on
Sep 15, 2003
Sold by
Wright Pamela J and Wright Scott W
Bought by
Warren Christine M and Warren Mark S
Current Estimated Value
Home Financials for this Owner
Home Financials are based on the most recent Mortgage that was taken out on this home.
Original Mortgage
$275,000
Outstanding Balance
$127,397
Interest Rate
6.22%
Mortgage Type
Purchase Money Mortgage
Estimated Equity
$599,047
Purchase Details
Closed on
Apr 30, 2001
Sold by
Fahey Daniel F and Fahey Colleen A
Bought by
Wright Scott W and Wright Pamela J
Home Financials for this Owner
Home Financials are based on the most recent Mortgage that was taken out on this home.
Original Mortgage
$227,900
Interest Rate
6.88%
Mortgage Type
Purchase Money Mortgage
Purchase Details
Closed on
Oct 14, 1999
Sold by
Orbison Corp
Bought by
Fahey Daniel F and Fahey Colleen A
Home Financials for this Owner
Home Financials are based on the most recent Mortgage that was taken out on this home.
Original Mortgage
$206,700
Interest Rate
7.8%
Mortgage Type
Purchase Money Mortgage
Create a Home Valuation Report for This Property
The Home Valuation Report is an in-depth analysis detailing your home's value as well as a comparison with similar homes in the area
Home Values in the Area
Average Home Value in this Area
Purchase History
| Date | Buyer | Sale Price | Title Company |
|---|---|---|---|
| Warren Christine M | $365,000 | -- | |
| Wright Scott W | $284,900 | -- | |
| Fahey Daniel F | $233,387 | -- |
Source: Public Records
Mortgage History
| Date | Status | Borrower | Loan Amount |
|---|---|---|---|
| Open | Warren Christine M | $275,000 | |
| Previous Owner | Fahey Daniel F | $227,900 | |
| Previous Owner | Fahey Daniel F | $206,700 |
Source: Public Records
Tax History Compared to Growth
Tax History
| Year | Tax Paid | Tax Assessment Tax Assessment Total Assessment is a certain percentage of the fair market value that is determined by local assessors to be the total taxable value of land and additions on the property. | Land | Improvement |
|---|---|---|---|---|
| 2025 | $8,194 | $657,600 | $214,400 | $443,200 |
| 2024 | $7,884 | $611,600 | $187,500 | $424,100 |
| 2023 | $7,384 | $524,400 | $169,600 | $354,800 |
| 2022 | $7,107 | $457,900 | $135,800 | $322,100 |
| 2021 | $3,586 | $425,700 | $135,800 | $289,900 |
| 2020 | $12,892 | $425,700 | $135,800 | $289,900 |
| 2019 | $4,686 | $394,800 | $130,900 | $263,900 |
| 2018 | $12,149 | $378,700 | $130,900 | $247,800 |
| 2017 | $6,263 | $369,300 | $115,100 | $254,200 |
| 2016 | $6,169 | $359,700 | $115,100 | $244,600 |
| 2015 | $5,930 | $346,800 | $115,100 | $231,700 |
| 2014 | $5,436 | $311,700 | $118,800 | $192,900 |
Source: Public Records
Map
Nearby Homes
- 7 Pine Hill Rd
- 55 Fisherville Terrace
- 44 Fisherville Terrace
- 185 Main St
- 51 Fisherville Terrace
- 58 Fisherville Terrace
- 50 Highland View Dr
- 109 Main St
- 110 Main St
- 19 Wildflower Dr
- 191 Hartness Rd
- 29 Sampson St Unit 29
- 29 Highland View Dr
- 5 Wildflower Dr
- 4 Greenlawn Ave
- 7 B Herbert Dr Unit 14
- 12 Central Turnpike
- 20 Millers Way Unit C
- 82 Central Turnpike
- 115 Ariel Cir
- 26 Leland Hill Rd
- 30 Leland Hill Rd
- 29 Leland Hill Rd
- 36 Leland Hill Rd
- 31 Leland Hill Rd
- 25 Leland Hill Rd
- 22 Leland Hill Rd
- 34 Leland Hill Rd
- 33 Leland Hill Rd
- 23 Leland Hill Rd
- 29 Peach Tree Dr
- 20 Leland Hill Rd
- 27 Peach Tree Dr
- 33 Peach Tree Dr
- 19 Leland Hill Rd
- 35 Peach Tree Dr
- 25 Peach Tree Dr
- 37 Leland Hill Rd
- 18 Leland Hill Rd
- 119 Hartness Rd