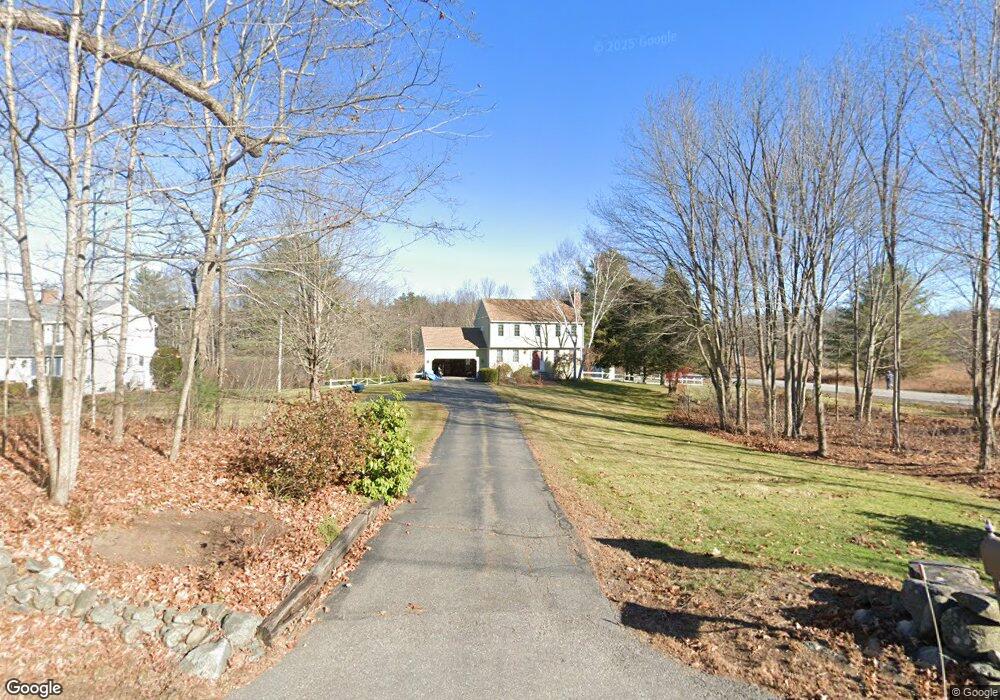
28 Piscassic Rd Newfields, NH 03856
Estimated Value: $661,892 - $755,000
3
Beds
3
Baths
2,384
Sq Ft
$300/Sq Ft
Est. Value
About This Home
This home is located at 28 Piscassic Rd, Newfields, NH 03856 and is currently estimated at $714,723, approximately $299 per square foot. 28 Piscassic Rd is a home located in Rockingham County with nearby schools including Newfields Elementary School, Cooperative Middle School, and Exeter High School.
Ownership History
Date
Name
Owned For
Owner Type
Purchase Details
Closed on
Jan 18, 2023
Sold by
Arvelo Wildolfo and Arvelo Linda M
Bought by
Arvelo Ft
Current Estimated Value
Purchase Details
Closed on
Aug 28, 2007
Sold by
Calias Nicholas P and Calias Jeanne
Bought by
Arvelo Wildolfo and Arvelo Linda M
Purchase Details
Closed on
Nov 7, 2002
Sold by
Quintal Paul C and Quintal Michelle S
Bought by
Calias Nicholas P
Purchase Details
Closed on
Oct 25, 1999
Sold by
Peterson Catherine A
Bought by
Quintal Paul C and Quintal Michelle S
Purchase Details
Closed on
Sep 11, 1997
Sold by
Foley Mark D and Foley Lynne P
Bought by
Peterson Catherine A
Create a Home Valuation Report for This Property
The Home Valuation Report is an in-depth analysis detailing your home's value as well as a comparison with similar homes in the area
Home Values in the Area
Average Home Value in this Area
Purchase History
| Date | Buyer | Sale Price | Title Company |
|---|---|---|---|
| Arvelo Ft | -- | None Available | |
| Arvelo Wildolfo | $395,000 | -- | |
| Calias Nicholas P | $305,000 | -- | |
| Quintal Paul C | $220,000 | -- | |
| Peterson Catherine A | $160,000 | -- |
Source: Public Records
Mortgage History
| Date | Status | Borrower | Loan Amount |
|---|---|---|---|
| Previous Owner | Peterson Catherine A | $310,000 | |
| Previous Owner | Peterson Catherine A | $315,500 | |
| Previous Owner | Peterson Catherine A | $315,455 |
Source: Public Records
Tax History
| Year | Tax Paid | Tax Assessment Tax Assessment Total Assessment is a certain percentage of the fair market value that is determined by local assessors to be the total taxable value of land and additions on the property. | Land | Improvement |
|---|---|---|---|---|
| 2025 | $9,623 | $567,700 | $230,800 | $336,900 |
| 2024 | $9,134 | $567,700 | $230,800 | $336,900 |
| 2023 | $8,964 | $567,700 | $230,800 | $336,900 |
| 2022 | $8,139 | $388,300 | $167,300 | $221,000 |
| 2021 | $8,029 | $390,700 | $167,300 | $223,400 |
| 2020 | $8,298 | $390,700 | $167,300 | $223,400 |
| 2019 | $8,045 | $390,700 | $167,300 | $223,400 |
| 2018 | $7,755 | $390,700 | $167,300 | $223,400 |
| 2017 | $8,132 | $339,700 | $166,900 | $172,800 |
| 2016 | $7,888 | $339,700 | $166,900 | $172,800 |
| 2015 | $7,823 | $339,700 | $166,900 | $172,800 |
| 2014 | $8,238 | $339,700 | $166,900 | $172,800 |
| 2013 | $8,248 | $339,700 | $166,900 | $172,800 |
Source: Public Records
Map
Nearby Homes
- 100 Exeter Rd
- 3 Swamscott St
- 57 Main St
- 85 College Rd
- 10 Wingate Ct
- 00 Piscassic & Oaklands Rd Unit 1
- 74 College Rd
- 0 Autumn Ln
- 9 Captain's Way
- 1 Firefly Landing
- 5 Ridge Rd
- 23 Winding Brook Dr
- 5 Stone Ridge Ln
- 0 Pear Tree Ln Unit 9
- 0 Pear Tree Ln Unit 10
- 3 Chisholm Farm Dr
- 14 Doe Run Ln
- 62 Green Rd
- 222 Portsmouth Ave
- 187 Grant Rd
- 30 Piscassic Rd
- 27 Piscassic Rd
- 25 Piscassic Rd
- 29 Piscassic Rd
- 31 Piscassic Rd
- 23 Piscassic Rd
- 33 Piscassic Rd
- 19 Piscassic Rd
- 37 Piscassic Rd
- 35 Piscassic Rd
- 45 Piscassic Rd
- 41 Piscassic Rd
- 42 Piscassic Rd
- 47 Piscassic Rd
- 5 Old Lee Rd
- 44 Piscassic Rd
- 7 Old Lee Rd
- 4 Dixon Ave
- 6 Piscassic Rd
- 18 Meadow Rd
Your Personal Tour Guide
Ask me questions while you tour the home.