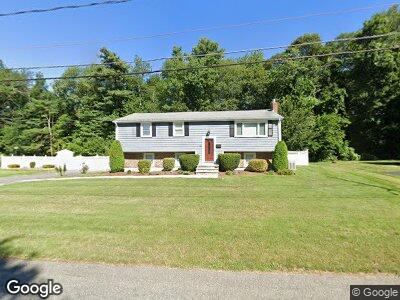
28 Ray Ave Brockton, MA 02301
Brockton Heights NeighborhoodEstimated Value: $508,000 - $556,000
3
Beds
1
Bath
1,672
Sq Ft
$319/Sq Ft
Est. Value
About This Home
This home is located at 28 Ray Ave, Brockton, MA 02301 and is currently estimated at $534,024, approximately $319 per square foot. 28 Ray Ave is a home located in Plymouth County with nearby schools including Hancock Elementary School, Manthala George Jr. School, and Louis F Angelo Elementary School.
Ownership History
Date
Name
Owned For
Owner Type
Purchase Details
Closed on
Feb 12, 2013
Sold by
Rappoli Peter
Bought by
Rappoli Peter and Rappoli Lori
Current Estimated Value
Home Financials for this Owner
Home Financials are based on the most recent Mortgage that was taken out on this home.
Original Mortgage
$200,000
Interest Rate
3.38%
Mortgage Type
New Conventional
Purchase Details
Closed on
Sep 24, 1996
Sold by
Harrison John L Est
Bought by
Rappoli Paul M and Rappoli Jean E
Create a Home Valuation Report for This Property
The Home Valuation Report is an in-depth analysis detailing your home's value as well as a comparison with similar homes in the area
Home Values in the Area
Average Home Value in this Area
Purchase History
| Date | Buyer | Sale Price | Title Company |
|---|---|---|---|
| Rappoli Peter | -- | -- | |
| Rappoli Paul M | $100,000 | -- |
Source: Public Records
Mortgage History
| Date | Status | Borrower | Loan Amount |
|---|---|---|---|
| Open | Rappoli Peter | $127,000 | |
| Closed | Rappoli Peter | $200,000 | |
| Previous Owner | Rappoli Paul M | $174,000 | |
| Previous Owner | Rappoli Paul M | $57,700 |
Source: Public Records
Tax History Compared to Growth
Tax History
| Year | Tax Paid | Tax Assessment Tax Assessment Total Assessment is a certain percentage of the fair market value that is determined by local assessors to be the total taxable value of land and additions on the property. | Land | Improvement |
|---|---|---|---|---|
| 2025 | $6,291 | $519,500 | $146,500 | $373,000 |
| 2024 | $5,927 | $493,100 | $146,500 | $346,600 |
| 2023 | $5,806 | $447,300 | $111,600 | $335,700 |
| 2022 | $5,194 | $371,800 | $101,500 | $270,300 |
| 2021 | $4,947 | $341,200 | $96,000 | $245,200 |
| 2020 | $27,303 | $327,900 | $91,900 | $236,000 |
| 2019 | $4,701 | $302,500 | $86,300 | $216,200 |
| 2018 | $20,120 | $277,800 | $86,300 | $191,500 |
| 2017 | $4,431 | $275,200 | $86,300 | $188,900 |
| 2016 | $3,960 | $228,100 | $82,300 | $145,800 |
| 2015 | $4,140 | $228,100 | $82,300 | $145,800 |
| 2014 | $3,951 | $217,900 | $82,300 | $135,600 |
Source: Public Records
Map
Nearby Homes
- 15 Cathy Ln
- 26 Thompson Ct
- 119 Esten Rd
- 24 Penniman Cir
- 0 Atkinson Ave
- 84 Murray Cir
- 1161 Pleasant St
- LOT 4 Winterberry Ln
- Lot 1 Winterberry Ln
- Lot 2 Winterberry Ln
- 20 Washington St Unit 1-5
- 27 Carrlyn Rd
- 89 Lucas Dr
- 1033 Pleasant St
- 35 Hancock Ave
- 0 Reservoir St
- 24 Santee Rd
- 827 Park St
- Lot 9 Lawler Ln
- 76 Sunset Dr