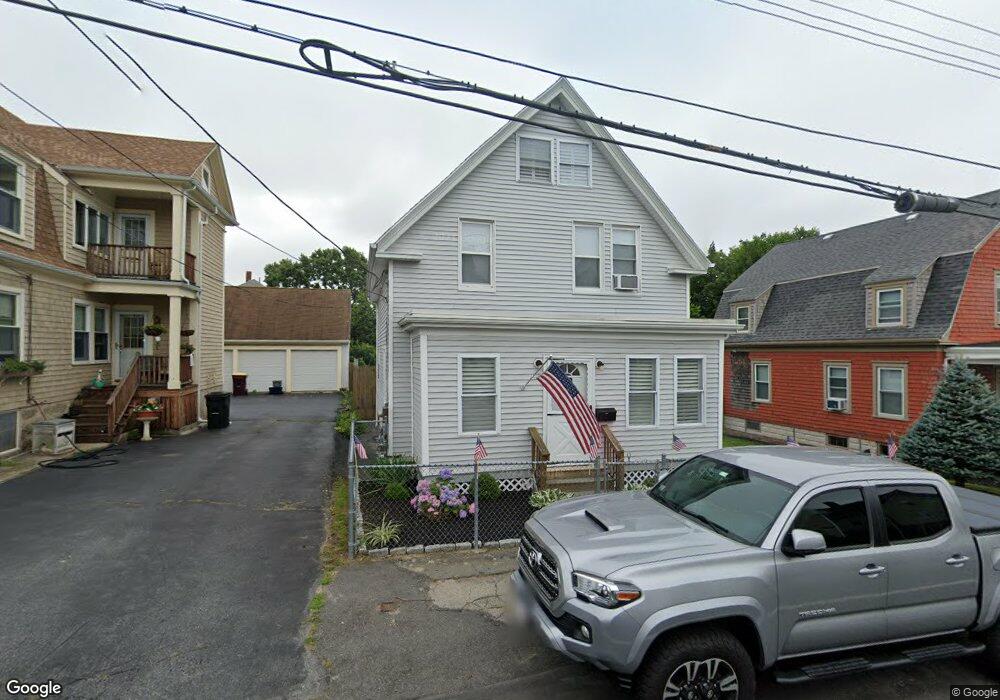
28 Slocum St Acushnet, MA 02743
Estimated Value: $391,000 - $443,000
3
Beds
2
Baths
1,604
Sq Ft
$263/Sq Ft
Est. Value
About This Home
This home is located at 28 Slocum St, Acushnet, MA 02743 and is currently estimated at $421,062, approximately $262 per square foot. 28 Slocum St is a home located in Bristol County with nearby schools including Acushnet Elementary School, Albert F Ford Middle School, and Alma Del Mar Charter School.
Ownership History
Date
Name
Owned For
Owner Type
Purchase Details
Closed on
Sep 25, 2009
Sold by
Costa Ryan D and Costa Crystal L
Bought by
Debalsi Bruce J
Current Estimated Value
Home Financials for this Owner
Home Financials are based on the most recent Mortgage that was taken out on this home.
Original Mortgage
$157,500
Interest Rate
5.31%
Mortgage Type
Purchase Money Mortgage
Purchase Details
Closed on
Sep 19, 2008
Sold by
Fnma
Bought by
Costa Crystal L and Costa Ryan D
Purchase Details
Closed on
Jun 3, 2008
Sold by
Messier Scott K and Fnma
Bought by
Federal National Mortgage Association
Purchase Details
Closed on
May 22, 2006
Sold by
Deering Audrey
Bought by
Messier Scott K
Purchase Details
Closed on
May 7, 2003
Sold by
Thomas Manuel A
Bought by
Deering Aubrey
Purchase Details
Closed on
Sep 15, 1989
Sold by
Laperriere Arthur J
Bought by
Thomas Manuel A
Create a Home Valuation Report for This Property
The Home Valuation Report is an in-depth analysis detailing your home's value as well as a comparison with similar homes in the area
Home Values in the Area
Average Home Value in this Area
Purchase History
| Date | Buyer | Sale Price | Title Company |
|---|---|---|---|
| Debalsi Bruce J | $175,000 | -- | |
| Costa Crystal L | $124,100 | -- | |
| Federal National Mortgage Association | $225,463 | -- | |
| Messier Scott K | $325,000 | -- | |
| Deering Aubrey | $217,000 | -- | |
| Thomas Manuel A | $90,000 | -- |
Source: Public Records
Mortgage History
| Date | Status | Borrower | Loan Amount |
|---|---|---|---|
| Open | Thomas Manuel A | $155,000 | |
| Closed | Thomas Manuel A | $157,500 |
Source: Public Records
Tax History Compared to Growth
Tax History
| Year | Tax Paid | Tax Assessment Tax Assessment Total Assessment is a certain percentage of the fair market value that is determined by local assessors to be the total taxable value of land and additions on the property. | Land | Improvement |
|---|---|---|---|---|
| 2025 | $33 | $303,800 | $87,600 | $216,200 |
| 2024 | $3,315 | $290,500 | $83,500 | $207,000 |
| 2023 | $3,173 | $264,400 | $75,400 | $189,000 |
| 2022 | $3,248 | $244,800 | $71,300 | $173,500 |
| 2021 | $2,955 | $213,700 | $71,300 | $142,400 |
| 2020 | $2,979 | $213,700 | $71,300 | $142,400 |
| 2019 | $2,752 | $194,100 | $63,200 | $130,900 |
| 2018 | $2,669 | $185,100 | $63,200 | $121,900 |
| 2017 | $2,567 | $177,800 | $63,200 | $114,600 |
| 2016 | $2,437 | $167,700 | $63,200 | $104,500 |
| 2015 | $2,395 | $167,700 | $63,200 | $104,500 |
Source: Public Records
Map
Nearby Homes