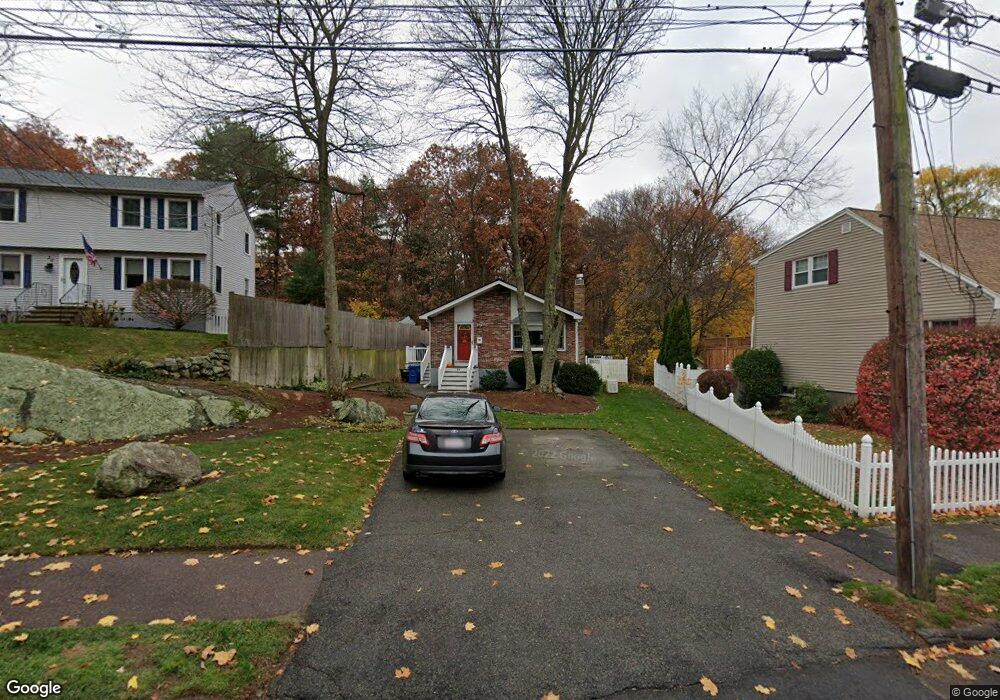
28 Stark Ave Wakefield, MA 01880
East Side NeighborhoodEstimated Value: $661,000 - $885,000
2
Beds
1
Bath
2,063
Sq Ft
$382/Sq Ft
Est. Value
About This Home
This home is located at 28 Stark Ave, Wakefield, MA 01880 and is currently estimated at $787,335, approximately $381 per square foot. 28 Stark Ave is a home located in Middlesex County with nearby schools including Wakefield Memorial High School, St Joseph School, and Odyssey Day School.
Ownership History
Date
Name
Owned For
Owner Type
Purchase Details
Closed on
Apr 28, 2022
Sold by
Iarrobino Anthony and Iarrobino Diane M
Bought by
Iarrobino Ft
Current Estimated Value
Create a Home Valuation Report for This Property
The Home Valuation Report is an in-depth analysis detailing your home's value as well as a comparison with similar homes in the area
Home Values in the Area
Average Home Value in this Area
Purchase History
| Date | Buyer | Sale Price | Title Company |
|---|---|---|---|
| Iarrobino Ft | -- | None Available |
Source: Public Records
Tax History Compared to Growth
Tax History
| Year | Tax Paid | Tax Assessment Tax Assessment Total Assessment is a certain percentage of the fair market value that is determined by local assessors to be the total taxable value of land and additions on the property. | Land | Improvement |
|---|---|---|---|---|
| 2025 | $7,796 | $686,900 | $407,500 | $279,400 |
| 2024 | $7,683 | $682,900 | $405,100 | $277,800 |
| 2023 | $7,305 | $622,800 | $369,400 | $253,400 |
| 2022 | $6,990 | $567,400 | $336,500 | $230,900 |
| 2021 | $6,900 | $542,000 | $313,800 | $228,200 |
| 2020 | $6,471 | $506,700 | $293,400 | $213,300 |
| 2019 | $6,180 | $481,700 | $278,900 | $202,800 |
| 2018 | $5,755 | $444,400 | $257,300 | $187,100 |
| 2017 | $5,411 | $415,300 | $240,500 | $174,800 |
| 2016 | $5,408 | $400,900 | $227,600 | $173,300 |
| 2015 | $5,048 | $374,500 | $212,600 | $161,900 |
| 2014 | $4,603 | $360,200 | $204,500 | $155,700 |
Source: Public Records
Map
Nearby Homes
- 6 Salisbury Rd
- 134 Nahant St Unit B
- 199 Nahant St
- 8 Everett St
- 38 Bennett St Unit 3D
- 9 Lilah Cir
- 1 Sidney St
- 5 Bateman Ct Unit 5
- 762 Main St
- 22 Jefferson Rd
- 772 Main St Unit 2
- 1 Millbrook Ln Unit 111
- 1 Millbrook Ln Unit 304
- 18 Crosby Rd
- 314 Water St Unit 5
- 51 Crescent St
- 69 Foundry St Unit 416
- 69 Foundry St Unit 310
- 6 Blue Jay Cir Unit 2
- 62 Foundry St Unit 310