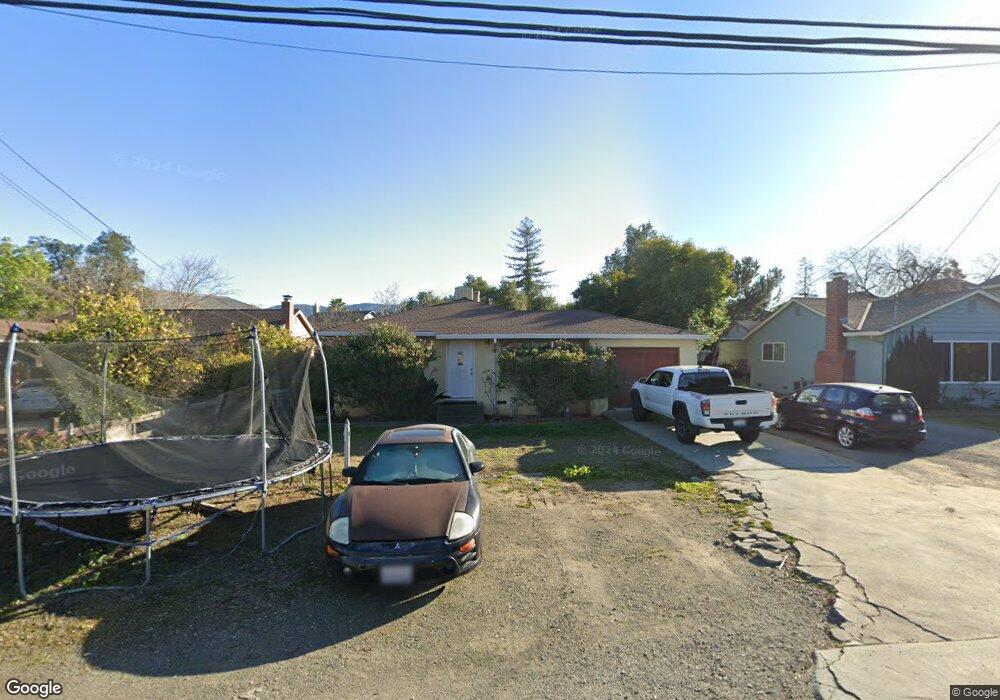
280 Redding Rd Campbell, CA 95008
Estimated Value: $1,204,000 - $1,809,000
3
Beds
1
Bath
870
Sq Ft
$1,697/Sq Ft
Est. Value
About This Home
This home is located at 280 Redding Rd, Campbell, CA 95008 and is currently estimated at $1,476,524, approximately $1,697 per square foot. 280 Redding Rd is a home located in Santa Clara County with nearby schools including Leigh High School, Branham High School, and Farnham Elementary School.
Ownership History
Date
Name
Owned For
Owner Type
Purchase Details
Closed on
Aug 20, 2021
Sold by
Johnasen Violet I and Bettencourt Madeleine Jane
Bought by
Johnasen Violet I and Bettencourt Madeleine Jane
Current Estimated Value
Purchase Details
Closed on
Jan 6, 1998
Sold by
Johnasen Benjamin T and Johnasen Violet I
Bought by
Johnasen Benjamin T and Johnasen Violet I
Home Financials for this Owner
Home Financials are based on the most recent Mortgage that was taken out on this home.
Original Mortgage
$85,000
Interest Rate
7.16%
Purchase Details
Closed on
Dec 28, 1994
Sold by
Johnasen Benjamin T and Johnasen Violet I
Bought by
Johnasen Benjamin T and Johnasen Violet I
Home Financials for this Owner
Home Financials are based on the most recent Mortgage that was taken out on this home.
Original Mortgage
$30,000
Interest Rate
9.29%
Create a Home Valuation Report for This Property
The Home Valuation Report is an in-depth analysis detailing your home's value as well as a comparison with similar homes in the area
Home Values in the Area
Average Home Value in this Area
Purchase History
| Date | Buyer | Sale Price | Title Company |
|---|---|---|---|
| Johnasen Violet I | -- | None Available | |
| Johnasen Benjamin T | -- | Fidelity National Title Ins | |
| Johnasen Benjamin T | -- | Fidelity National Title Ins | |
| Johnasen Benjamin T | -- | Old Republic Title Company | |
| Johnasen Benjamin T | -- | Old Republic Title Company |
Source: Public Records
Mortgage History
| Date | Status | Borrower | Loan Amount |
|---|---|---|---|
| Closed | Johnasen Benjamin T | $85,000 | |
| Closed | Johnasen Benjamin T | $30,000 |
Source: Public Records
Tax History
| Year | Tax Paid | Tax Assessment Tax Assessment Total Assessment is a certain percentage of the fair market value that is determined by local assessors to be the total taxable value of land and additions on the property. | Land | Improvement |
|---|---|---|---|---|
| 2025 | $1,918 | $54,689 | $30,692 | $23,997 |
| 2024 | $1,918 | $53,618 | $30,091 | $23,527 |
| 2023 | $1,908 | $52,567 | $29,501 | $23,066 |
| 2022 | $1,902 | $51,537 | $28,923 | $22,614 |
| 2021 | $1,839 | $50,527 | $28,356 | $22,171 |
| 2020 | $1,767 | $50,010 | $28,066 | $21,944 |
| 2019 | $1,726 | $49,030 | $27,516 | $21,514 |
| 2018 | $1,670 | $48,070 | $26,977 | $21,093 |
| 2017 | $1,546 | $47,129 | $26,449 | $20,680 |
| 2016 | $1,457 | $46,206 | $25,931 | $20,275 |
| 2015 | $1,457 | $45,513 | $25,542 | $19,971 |
| 2014 | $1,426 | $44,622 | $25,042 | $19,580 |
Source: Public Records
Map
Nearby Homes
- 1526 Redding Park Ln
- 135 Redding Rd Unit A
- 3492 Wine Barrel Way
- 101 Redding Rd Unit A4
- 1500 Camden Ave
- 3449 Wine Cask Way
- 404 Shamrock Dr
- 3673 S Bascom Ave
- 1155 Shamrock Dr
- 2289 Sun Glory Ln Unit A
- 3685 Calvin Ave
- 1054 Longfellow Ave
- 2265 Sun Glory Ln Unit A
- 2265 Sun Glory Ln Unit B
- 1061 Shamrock Dr
- 2163 Woodard Rd
- 2867 Via Carmen
- 956 Norin Ct
- 341 Dallas Dr
- 401 Dallas Dr
- 300 Redding Rd
- 270 Redding Rd
- 304 Redding Rd
- 1520 Redding Park Ln
- 1522 Redding Park Ln
- 310 Redding Rd
- 1528 Redding Park Ln
- 289 Redding Rd
- 308 Redding Rd
- 291 Redding Rd
- 1512 Parsons Ave
- 299 Redding Rd
- 312 Redding Rd
- 1530 Redding Park Ln
- 1521 Redding Park Ln
- 1523 Redding Park Ln
- 255 Shelley Ave
- 1525 Redding Park Ln
- 309 Redding Rd
- 1521 Parsons Ave
Your Personal Tour Guide
Ask me questions while you tour the home.