Estimated Value: $392,444 - $442,000
3
Beds
1
Bath
1,370
Sq Ft
$309/Sq Ft
Est. Value
About This Home
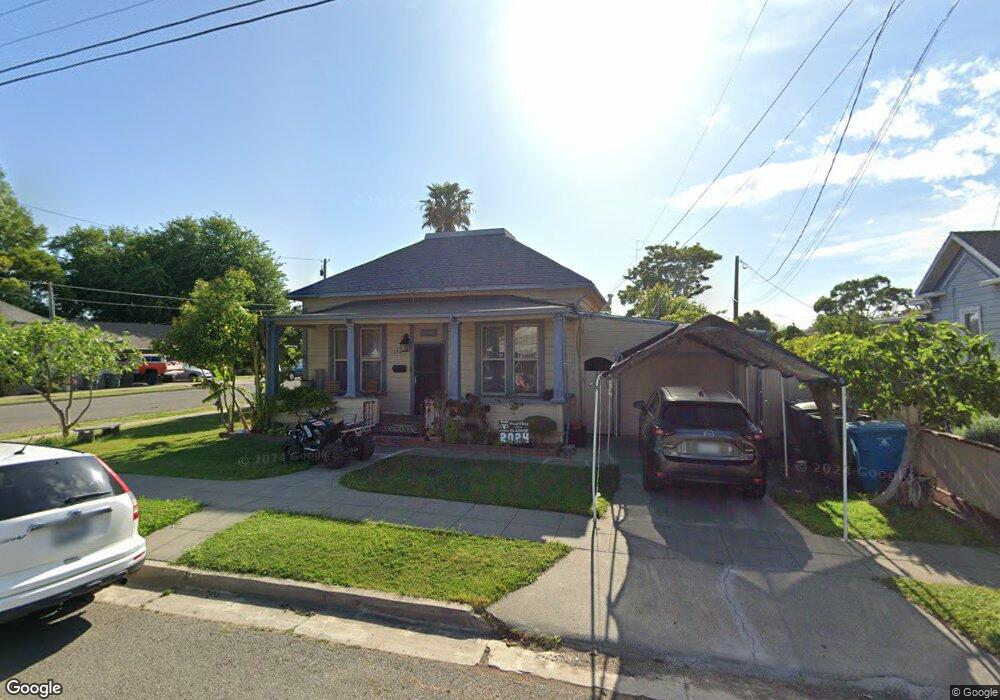
This home is located at 280 S 3rd St, Dixon, CA 95620 and is currently estimated at $423,111, approximately $308 per square foot. 280 S 3rd St is a home located in Solano County with nearby schools including Anderson (Linford L.) Elementary School, Dixon High School, and Dixon Montessori Charter.
Ownership History
Date
Name
Owned For
Owner Type
Purchase Details
Closed on
Mar 17, 2003
Sold by
Paat Ramiro and Paat Maria L
Bought by
Valdivia Victor and Valdivia Marisol
Current Estimated Value
Home Financials for this Owner
Home Financials are based on the most recent Mortgage that was taken out on this home.
Original Mortgage
$165,000
Outstanding Balance
$70,467
Interest Rate
5.79%
Mortgage Type
Stand Alone First
Estimated Equity
$352,644
Purchase Details
Closed on
Nov 25, 1996
Sold by
Geroge Farrell and Geroge Jeanette J
Bought by
Resendiz Robert J and Resendiz Gloria
Home Financials for this Owner
Home Financials are based on the most recent Mortgage that was taken out on this home.
Original Mortgage
$87,423
Interest Rate
7.91%
Mortgage Type
FHA
Create a Home Valuation Report for This Property
The Home Valuation Report is an in-depth analysis detailing your home's value as well as a comparison with similar homes in the area
Home Values in the Area
Average Home Value in this Area
Purchase History
| Date | Buyer | Sale Price | Title Company |
|---|---|---|---|
| Valdivia Victor | $165,000 | Placer Title Co | |
| Paat Ramiro | -- | Placer Title Co | |
| Resendiz Robert J | $95,000 | First American Title Guarant |
Source: Public Records
Mortgage History
| Date | Status | Borrower | Loan Amount |
|---|---|---|---|
| Open | Valdivia Victor | $165,000 | |
| Previous Owner | Resendiz Robert J | $87,423 |
Source: Public Records
Tax History
| Year | Tax Paid | Tax Assessment Tax Assessment Total Assessment is a certain percentage of the fair market value that is determined by local assessors to be the total taxable value of land and additions on the property. | Land | Improvement |
|---|---|---|---|---|
| 2025 | $1,723 | $154,723 | $57,004 | $97,719 |
| 2024 | $1,723 | $151,690 | $55,887 | $95,803 |
| 2023 | $1,672 | $148,717 | $54,792 | $93,925 |
| 2022 | $1,648 | $145,802 | $53,718 | $92,084 |
| 2021 | $1,628 | $142,944 | $52,665 | $90,279 |
| 2020 | $1,602 | $141,479 | $52,125 | $89,354 |
| 2019 | $1,572 | $138,705 | $51,103 | $87,602 |
| 2018 | $1,566 | $135,986 | $50,101 | $85,885 |
| 2017 | $1,527 | $133,320 | $49,119 | $84,201 |
| 2016 | $1,454 | $130,706 | $48,156 | $82,550 |
| 2015 | $1,420 | $128,744 | $47,433 | $81,311 |
| 2014 | $1,406 | $126,223 | $46,504 | $79,719 |
Source: Public Records
Map
Nearby Homes
Your Personal Tour Guide
Ask me questions while you tour the home.