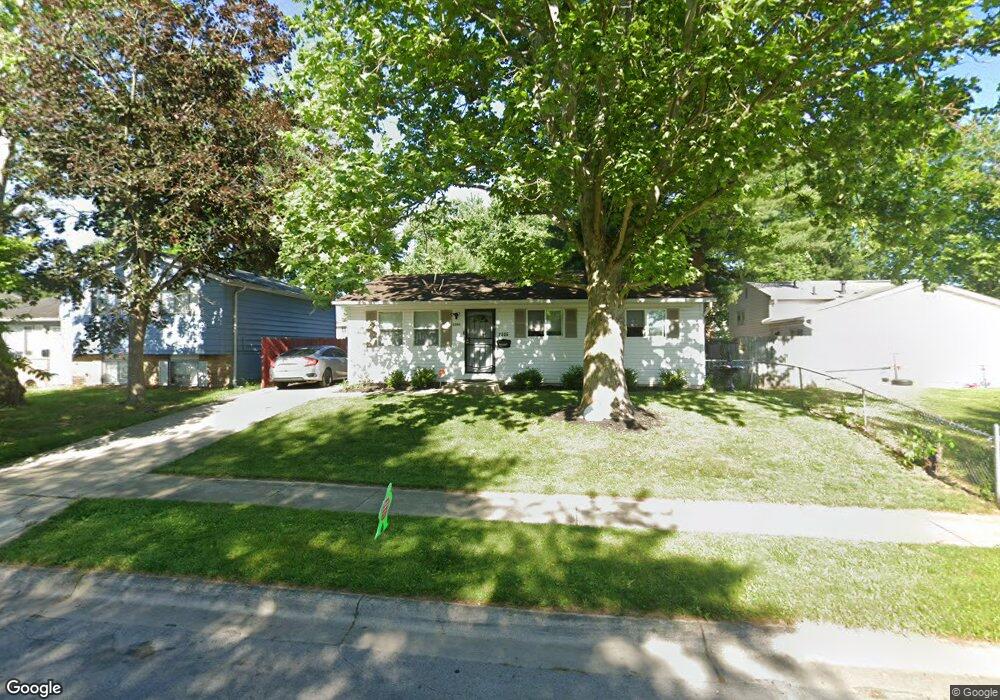
2800 Glenbriar St Columbus, OH 43232
Walnut Heights NeighborhoodEstimated Value: $200,000 - $216,000
3
Beds
1
Bath
1,328
Sq Ft
$156/Sq Ft
Est. Value
About This Home
This home is located at 2800 Glenbriar St, Columbus, OH 43232 and is currently estimated at $207,333, approximately $156 per square foot. 2800 Glenbriar St is a home located in Franklin County with nearby schools including Liberty Elementary School, Yorktown Middle School, and Independence High School.
Ownership History
Date
Name
Owned For
Owner Type
Purchase Details
Closed on
Oct 19, 2010
Sold by
Martin Chris
Bought by
Ez Home Solutions Group Llc
Current Estimated Value
Purchase Details
Closed on
Aug 24, 2010
Sold by
Fannie Mae
Bought by
Martin Chris
Purchase Details
Closed on
Jun 17, 2010
Sold by
Goodwin Richard C and Goodwin Norann L
Bought by
Federal National Mortgage Association
Purchase Details
Closed on
Jul 20, 1992
Bought by
Goodwin Richard C
Purchase Details
Closed on
Dec 15, 1989
Purchase Details
Closed on
Feb 1, 1987
Create a Home Valuation Report for This Property
The Home Valuation Report is an in-depth analysis detailing your home's value as well as a comparison with similar homes in the area
Home Values in the Area
Average Home Value in this Area
Purchase History
| Date | Buyer | Sale Price | Title Company |
|---|---|---|---|
| Ez Home Solutions Group Llc | -- | None Available | |
| Ez Home Solutions Group Llc | -- | None Available | |
| Martin Chris | $47,000 | Stewart Tit | |
| Federal National Mortgage Association | $54,000 | None Available | |
| Goodwin Richard C | $62,900 | -- | |
| -- | $54,200 | -- | |
| -- | $48,000 | -- |
Source: Public Records
Tax History Compared to Growth
Tax History
| Year | Tax Paid | Tax Assessment Tax Assessment Total Assessment is a certain percentage of the fair market value that is determined by local assessors to be the total taxable value of land and additions on the property. | Land | Improvement |
|---|---|---|---|---|
| 2024 | $2,246 | $49,000 | $17,150 | $31,850 |
| 2023 | $2,946 | $65,100 | $17,150 | $47,950 |
| 2022 | $1,228 | $23,100 | $5,460 | $17,640 |
| 2021 | $1,301 | $23,100 | $5,460 | $17,640 |
| 2020 | $1,249 | $23,100 | $5,460 | $17,640 |
| 2019 | $1,197 | $19,250 | $4,550 | $14,700 |
| 2018 | $597 | $19,250 | $4,550 | $14,700 |
| 2017 | $1,197 | $19,250 | $4,550 | $14,700 |
| 2016 | $999 | $14,710 | $3,750 | $10,960 |
| 2015 | $455 | $14,710 | $3,750 | $10,960 |
| 2014 | $1,103 | $17,790 | $3,750 | $14,040 |
| 2013 | $604 | $19,740 | $4,165 | $15,575 |
Source: Public Records
Map
Nearby Homes
- 5278 Glenbriar Ct
- 2730 Raphael Dr
- 2651 Brownfield Rd
- 2705 Denmark Rd
- 5377 Bleaker Ave
- 2744 Barrows Rd
- 2736 Barrows Rd
- 5268 Carbondale Dr
- 5401 Spire Ln
- 5373 Spire Ln
- 2991 Blue Moon Dr
- 2998 Osgood Rd E
- 5011 Refugee Rd
- 5114 Carbondale Dr
- 2447 Maybury Rd
- 3148 Aldgate St
- 5061 Labelle Dr
- 3198 Gallant Dr
- 5123 Jameson Dr
- 5125 Upton Rd N
- 2806 Glenbriar St
- 2792 Glenbriar St
- 2786 Glenbriar St
- 5314 Refugee Rd
- 5326 Refugee Rd
- 2799 Moundcrest St
- 2793 Glenbriar St
- 2793 Moundcrest St
- 5760 Glenbriar Ct
- 2778 Glenbriar St
- 5334 Refugee Rd
- 0 Refugee Rd
- 2803 Glenbriar St
- 2787 Moundcrest St
- 5340 Refugee Rd
- 5297 Glenbriar Ct
- 5288 Refugee Rd
- 2772 Glenbriar St
- 2805 Moundcrest St
- 2781 Moundcrest St