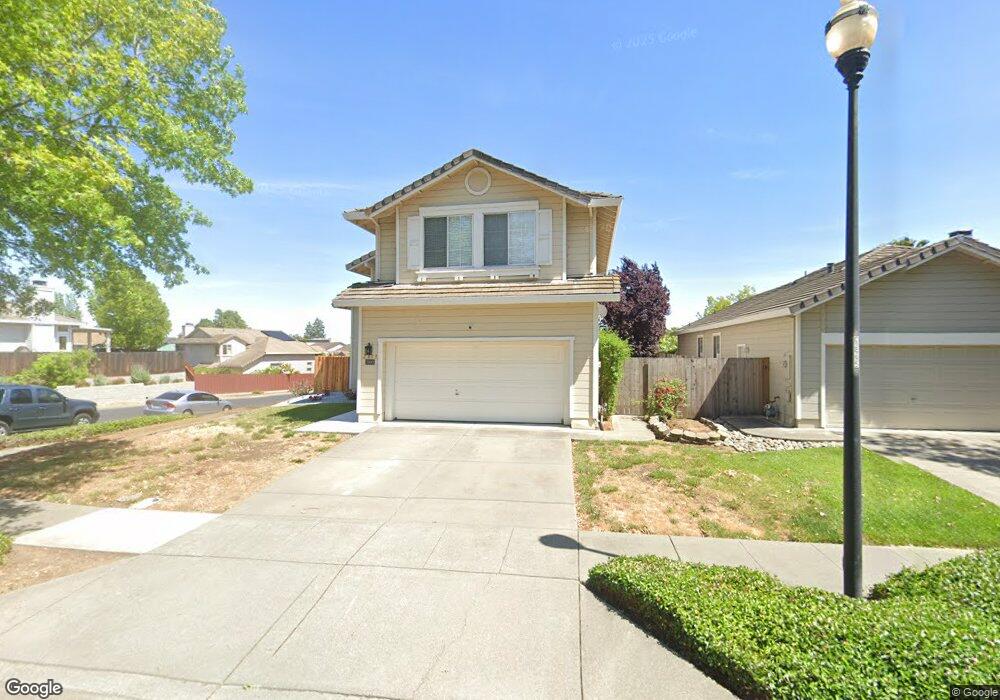
2800 Hillview Dr Fairfield, CA 94534
Estimated Value: $612,275 - $667,000
4
Beds
3
Baths
1,859
Sq Ft
$342/Sq Ft
Est. Value
About This Home
This home is located at 2800 Hillview Dr, Fairfield, CA 94534 and is currently estimated at $635,069, approximately $341 per square foot. 2800 Hillview Dr is a home located in Solano County with nearby schools including Rolling Hills Elementary School, Fairfield High School, and Solano Christian Academy.
Ownership History
Date
Name
Owned For
Owner Type
Purchase Details
Closed on
May 4, 2023
Sold by
Grewal Rajbir Singh and Tasvir Kaur
Bought by
Grewal Rajbir Singh and Grewal Tasvir Kaur
Current Estimated Value
Home Financials for this Owner
Home Financials are based on the most recent Mortgage that was taken out on this home.
Original Mortgage
$164,700
Outstanding Balance
$160,062
Interest Rate
6.32%
Mortgage Type
Credit Line Revolving
Estimated Equity
$475,007
Purchase Details
Closed on
Feb 3, 1998
Sold by
Oliver Michael S and Oliver Alicia R
Bought by
Grewal Rajbir Singh and Takhar Grewal Tasvir
Home Financials for this Owner
Home Financials are based on the most recent Mortgage that was taken out on this home.
Original Mortgage
$158,850
Interest Rate
6.95%
Purchase Details
Closed on
Feb 21, 1996
Sold by
Oceanis
Bought by
Oliver Michael S and Oliver Alicia R
Home Financials for this Owner
Home Financials are based on the most recent Mortgage that was taken out on this home.
Original Mortgage
$170,952
Interest Rate
7.1%
Create a Home Valuation Report for This Property
The Home Valuation Report is an in-depth analysis detailing your home's value as well as a comparison with similar homes in the area
Purchase History
| Date | Buyer | Sale Price | Title Company |
|---|---|---|---|
| Grewal Rajbir Singh | -- | Chicago Title Company | |
| Grewal Rajbir Singh | $176,500 | North American Title Co | |
| Oliver Michael S | $180,000 | -- |
Source: Public Records
Mortgage History
| Date | Status | Borrower | Loan Amount |
|---|---|---|---|
| Open | Grewal Rajbir Singh | $164,700 | |
| Previous Owner | Grewal Rajbir Singh | $158,850 | |
| Previous Owner | Oliver Michael S | $170,952 |
Source: Public Records
Tax History
| Year | Tax Paid | Tax Assessment Tax Assessment Total Assessment is a certain percentage of the fair market value that is determined by local assessors to be the total taxable value of land and additions on the property. | Land | Improvement |
|---|---|---|---|---|
| 2025 | $3,579 | $281,821 | $79,835 | $201,986 |
| 2024 | $3,579 | $276,296 | $78,270 | $198,026 |
| 2023 | $3,479 | $270,880 | $76,736 | $194,144 |
| 2022 | $3,495 | $265,570 | $75,232 | $190,338 |
| 2021 | $3,463 | $260,363 | $73,757 | $186,606 |
| 2020 | $3,588 | $257,694 | $73,001 | $184,693 |
| 2019 | $3,516 | $252,642 | $71,570 | $181,072 |
| 2018 | $3,584 | $247,689 | $70,167 | $177,522 |
| 2017 | $3,611 | $242,834 | $68,792 | $174,042 |
| 2016 | $3,584 | $238,074 | $67,444 | $170,630 |
| 2015 | $3,397 | $234,498 | $66,431 | $168,067 |
| 2014 | $3,370 | $229,905 | $65,130 | $164,775 |
Source: Public Records
Map
Nearby Homes
- 120 Goya Dr
- 2220 Fox Glen Dr
- 41 Goya Dr
- 15 Dali Ct
- 2472 Vista Grande
- 393 Manzanita Ave
- 2611 Lilac St
- 278 Jasmine St
- 2837 Watson Ct
- 58 Del Prado Cir
- 2795 Vista Palomar
- 2731 Orchid St
- 2915 N Texas St Unit 129
- 2915 N Texas St Unit 157
- 1308 Sunningdale Ln
- 1300 Sunningdale Ln
- 1301 Sunningdale Ln
- 209 Begonia Blvd
- 3227 Balmoral Ct
- 2292 Rutland Ct
- 2796 Hillview Dr
- 2792 Hillview Dr
- 2795 Parkview Terrace
- 2806 Hillview Ct
- 2791 Parkview Terrace
- 2797 Hillview Dr
- 2801 Parkview Terrace
- 2810 Hillview Ct
- 2787 Parkview Terrace
- 2793 Hillview Dr
- 2789 Hillview Dr
- 2784 Hillview Dr
- 2803 Hillview Ct
- 2783 Parkview Terrace
- 2785 Hillview Dr
- 2814 Hillview Ct
- 2805 Parkview Terrace
- 2780 Hillview Dr
- 2781 Hillview Dr
Your Personal Tour Guide
Ask me questions while you tour the home.