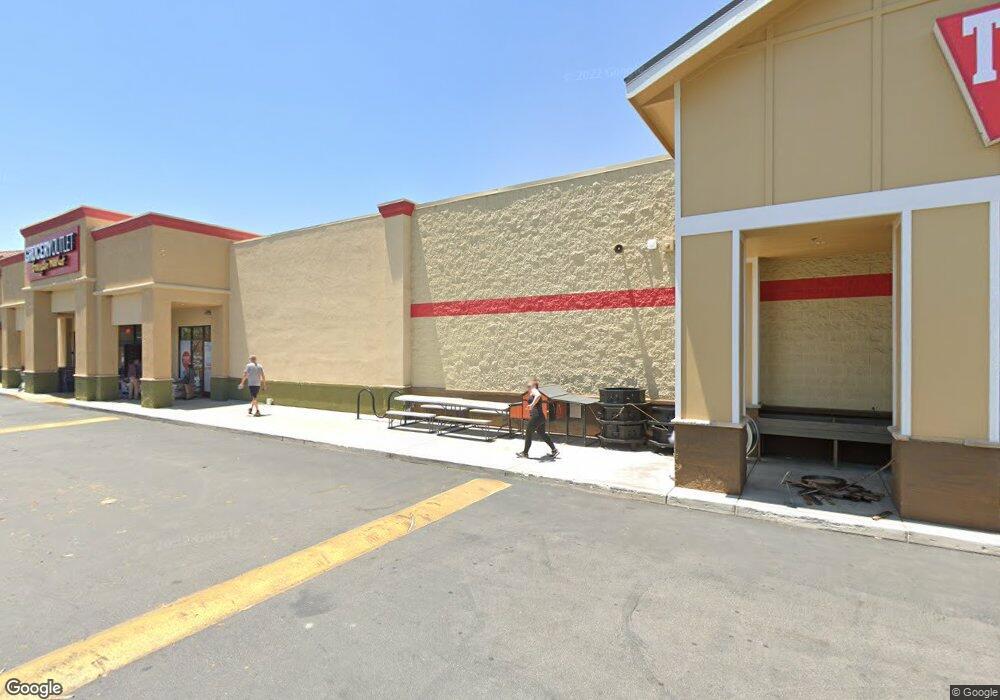
2800 Riverside Ave Paso Robles, CA 93446
Estimated Value: $5,988,462
Studio
--
Bath
67,840
Sq Ft
$88/Sq Ft
Est. Value
About This Home
This home is located at 2800 Riverside Ave, Paso Robles, CA 93446 and is currently estimated at $5,988,462, approximately $88 per square foot. 2800 Riverside Ave is a home located in San Luis Obispo County with nearby schools including Georgia Brown Dual Immersion Magnet Elementary School, George H. Flamson Middle School, and Paso Robles High School.
Ownership History
Date
Name
Owned For
Owner Type
Purchase Details
Closed on
May 7, 2012
Sold by
Nwk2 Inc
Bought by
2800 Riverside Paso Llc
Current Estimated Value
Purchase Details
Closed on
Jul 19, 2010
Sold by
Pilg Tim L
Bought by
Nwk2 Inc
Purchase Details
Closed on
Apr 1, 2004
Sold by
Pilg Frances Hoff
Bought by
Pilg Timothy L
Home Financials for this Owner
Home Financials are based on the most recent Mortgage that was taken out on this home.
Original Mortgage
$2,246,000
Interest Rate
5.92%
Mortgage Type
Commercial
Purchase Details
Closed on
Feb 23, 2004
Sold by
Dagovitz Melvin and Dagovitz Angela
Bought by
Pilg Timothy L
Home Financials for this Owner
Home Financials are based on the most recent Mortgage that was taken out on this home.
Original Mortgage
$2,246,000
Interest Rate
5.92%
Mortgage Type
Commercial
Create a Home Valuation Report for This Property
The Home Valuation Report is an in-depth analysis detailing your home's value as well as a comparison with similar homes in the area
Purchase History
| Date | Buyer | Sale Price | Title Company |
|---|---|---|---|
| 2800 Riverside Paso Llc | $2,400,000 | First American Title Company | |
| Nwk2 Inc | $3,296,431 | First American Title Ins Co | |
| Pilg Timothy L | -- | Chicago Title Company | |
| Pilg Timothy L | $3,900,000 | Chicago Title Company |
Source: Public Records
Mortgage History
| Date | Status | Borrower | Loan Amount |
|---|---|---|---|
| Previous Owner | Pilg Timothy L | $2,246,000 | |
| Closed | Pilg Timothy L | $1,264,000 |
Source: Public Records
Tax History
| Year | Tax Paid | Tax Assessment Tax Assessment Total Assessment is a certain percentage of the fair market value that is determined by local assessors to be the total taxable value of land and additions on the property. | Land | Improvement |
|---|---|---|---|---|
| 2025 | $36,883 | $3,383,952 | $1,444,458 | $1,939,494 |
| 2024 | $36,282 | $3,317,601 | $1,416,136 | $1,901,465 |
| 2023 | $36,282 | $3,252,551 | $1,388,369 | $1,864,182 |
| 2022 | $35,742 | $3,188,777 | $1,361,147 | $1,827,630 |
| 2021 | $35,132 | $3,126,253 | $1,334,458 | $1,791,795 |
| 2020 | $34,654 | $3,094,198 | $1,320,775 | $1,773,423 |
| 2019 | $34,163 | $3,033,528 | $1,294,878 | $1,738,650 |
| 2018 | $33,698 | $2,974,048 | $1,269,489 | $1,704,559 |
| 2017 | $31,687 | $2,915,735 | $1,244,598 | $1,671,137 |
| 2016 | $31,065 | $2,858,565 | $1,220,195 | $1,638,370 |
| 2015 | $30,949 | $2,815,628 | $1,201,867 | $1,613,761 |
| 2014 | $29,874 | $2,760,475 | $1,178,325 | $1,582,150 |
Source: Public Records
Map
Nearby Homes
- 740 30th St
- 3121 Spring St Unit 106
- 2458 Altadena Ln
- 2145 Park St
- 2424 Traditions Loop
- 2425 Traditions Loop
- 2757 Traditions Loop
- 2221 Oak St
- 2649 Clubhouse Dr
- 2237 Vine St
- 2642 Vineyard Cir
- 102 Glencrest Ln
- 706 Manor Ln
- 1810 Park St
- 1803 Pine St
- 534 Fein Ave
- 707 Manor Ln
- 701 Manor Ln
- 713 Manor Ln
- 719 Manor Ln
- 2801 Riverside Ave
- 2805 Black Oak Dr
- 2780 Riverside Ave
- 1124 Black Oak Dr
- 1124 Black Oak Dr Unit rear
- 1144 1144 Black Oak Dr
- 1144 Black Oak Dr
- 1144 Black Oak Dr
- 2901 Riverside Ave
- 2630 Riverside Ave
- 2951 Riverside Ave
- 2631 Riverside Ave
- 3002 Riverside Ave
- 2621 Riverside Ave
- 2525 Riverside Ave
- 2738 Park St
- 3200 Riverside Ave
- 3200 Riverside Ave Unit 130
- 3200 Riverside Ave Unit 140
- 3200 Riverside Ave Unit 110
Your Personal Tour Guide
Ask me questions while you tour the home.