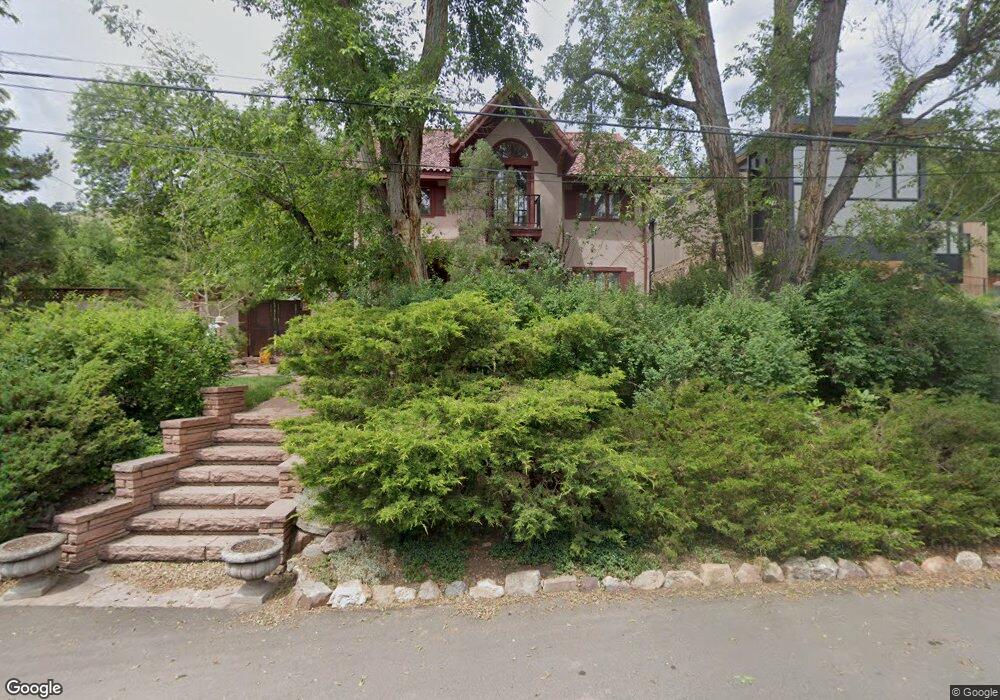
2801 3rd St Boulder, CO 80304
Newlands NeighborhoodEstimated Value: $2,178,000 - $2,682,000
3
Beds
4
Baths
3,168
Sq Ft
$782/Sq Ft
Est. Value
About This Home
This home is located at 2801 3rd St, Boulder, CO 80304 and is currently estimated at $2,476,120, approximately $781 per square foot. 2801 3rd St is a home located in Boulder County with nearby schools including Foothill Elementary School, Casey Middle School, and Boulder High School.
Ownership History
Date
Name
Owned For
Owner Type
Purchase Details
Closed on
Dec 13, 1993
Sold by
Bolduc Stevie Ann
Bought by
Tipple Michele
Current Estimated Value
Home Financials for this Owner
Home Financials are based on the most recent Mortgage that was taken out on this home.
Original Mortgage
$125,000
Interest Rate
7.19%
Purchase Details
Closed on
Sep 21, 1990
Bought by
Tipple Michele
Purchase Details
Closed on
Sep 18, 1978
Bought by
Tipple Michele
Purchase Details
Closed on
Jun 5, 1974
Bought by
Tipple Michele
Create a Home Valuation Report for This Property
The Home Valuation Report is an in-depth analysis detailing your home's value as well as a comparison with similar homes in the area
Home Values in the Area
Average Home Value in this Area
Purchase History
| Date | Buyer | Sale Price | Title Company |
|---|---|---|---|
| Tipple Michele | $425,000 | -- | |
| Tipple Michele | -- | -- | |
| Tipple Michele | $63,000 | -- | |
| Tipple Michele | $19,500 | -- |
Source: Public Records
Mortgage History
| Date | Status | Borrower | Loan Amount |
|---|---|---|---|
| Closed | Tipple Michele | $125,000 |
Source: Public Records
Tax History
| Year | Tax Paid | Tax Assessment Tax Assessment Total Assessment is a certain percentage of the fair market value that is determined by local assessors to be the total taxable value of land and additions on the property. | Land | Improvement |
|---|---|---|---|---|
| 2025 | $15,185 | $159,938 | $135,144 | $24,794 |
| 2024 | $15,185 | $159,938 | $135,144 | $24,794 |
| 2023 | $14,921 | $179,480 | $148,861 | $34,304 |
| 2022 | $11,993 | $136,095 | $105,584 | $30,511 |
| 2021 | $11,436 | $140,012 | $108,623 | $31,389 |
| 2020 | $9,971 | $121,700 | $94,952 | $26,748 |
| 2019 | $10,431 | $121,700 | $94,952 | $26,748 |
| 2018 | $9,555 | $110,203 | $78,336 | $31,867 |
| 2017 | $9,256 | $121,836 | $86,605 | $35,231 |
| 2016 | $9,231 | $106,633 | $65,750 | $40,883 |
| 2015 | $8,741 | $81,630 | $38,208 | $43,422 |
| 2014 | $6,864 | $81,630 | $38,208 | $43,422 |
Source: Public Records
Map
Nearby Homes
- 2675 Dakota Place Unit Newlands
- 3015 3rd St
- 515 Alpine Ave
- 3033 3rd St
- 2958 6th St
- 534 Dewey Ave
- 501 Evergreen Ave
- 815 Alpine Ave Unit 2
- 653 Dewey Ave
- 3150 5th St
- 2449 5th St
- 300 Forest Ave
- 3056 8th St
- 3189 5th St
- 2409 5th St
- 900 Portland Place
- 1009 Portland Place
- 946 Portland Place
- 5228 Sunshine Canyon Dr
- 5405 Sunshine Canyon Dr
Your Personal Tour Guide
Ask me questions while you tour the home.