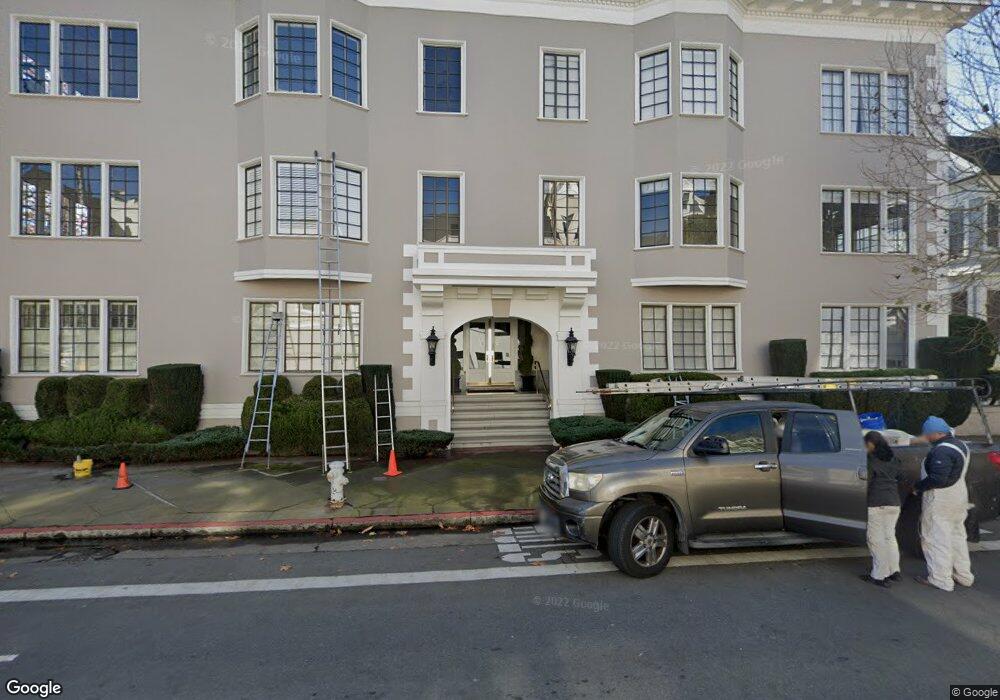
2801 Jackson St Unit 7 San Francisco, CA 94115
Pacific Heights NeighborhoodEstimated Value: $1,616,000 - $1,834,000
2
Beds
1
Bath
1,300
Sq Ft
$1,333/Sq Ft
Est. Value
About This Home
This home is located at 2801 Jackson St Unit 7, San Francisco, CA 94115 and is currently estimated at $1,733,160, approximately $1,333 per square foot. 2801 Jackson St Unit 7 is a home located in San Francisco County with nearby schools including Cobb (William L.) Elementary School, Roosevelt Middle School, and Town School For Boys.
Ownership History
Date
Name
Owned For
Owner Type
Purchase Details
Closed on
May 12, 2025
Sold by
2801-204 Jackson Street Llc
Bought by
Kirby Elizabeth and Schreiber William
Current Estimated Value
Home Financials for this Owner
Home Financials are based on the most recent Mortgage that was taken out on this home.
Original Mortgage
$1,374,400
Outstanding Balance
$1,366,638
Interest Rate
5.38%
Mortgage Type
New Conventional
Estimated Equity
$366,522
Purchase Details
Closed on
Mar 28, 2023
Sold by
Baldwin Family Trust
Bought by
2801-204 Jackson Street Llc
Purchase Details
Closed on
Oct 14, 2020
Sold by
Griffin Caro Correia and The Tillie Frances Mccullough
Bought by
Baldwin Gerald and Baldwin Jane A
Purchase Details
Closed on
Jul 9, 2020
Sold by
Mccullough Tillie
Bought by
Griffin Carol Correia and Tillie Frances Mccullough
Create a Home Valuation Report for This Property
The Home Valuation Report is an in-depth analysis detailing your home's value as well as a comparison with similar homes in the area
Home Values in the Area
Average Home Value in this Area
Purchase History
| Date | Buyer | Sale Price | Title Company |
|---|---|---|---|
| Kirby Elizabeth | -- | First American Title | |
| 2801-204 Jackson Street Llc | $1,800,000 | First American Title | |
| Baldwin Gerald | $1,500,000 | Chicago Title Company | |
| Griffin Carol Correia | -- | None Available |
Source: Public Records
Mortgage History
| Date | Status | Borrower | Loan Amount |
|---|---|---|---|
| Open | Kirby Elizabeth | $1,374,400 |
Source: Public Records
Tax History
| Year | Tax Paid | Tax Assessment Tax Assessment Total Assessment is a certain percentage of the fair market value that is determined by local assessors to be the total taxable value of land and additions on the property. | Land | Improvement |
|---|---|---|---|---|
| 2025 | $22,358 | $1,872,720 | $1,123,632 | $749,088 |
| 2024 | $22,358 | $1,836,000 | $1,101,600 | $734,400 |
| 2023 | $19,188 | $1,560,600 | $936,360 | $624,240 |
| 2022 | $18,820 | $1,530,000 | $918,000 | $612,000 |
| 2021 | $18,489 | $1,500,000 | $900,000 | $600,000 |
| 2020 | $4,684 | $385,420 | $127,179 | $258,241 |
| 2019 | $4,525 | $377,864 | $124,686 | $253,178 |
| 2018 | $4,376 | $370,456 | $122,242 | $248,214 |
| 2017 | $4,324 | $363,194 | $119,846 | $243,348 |
| 2016 | $4,233 | $356,074 | $117,497 | $238,577 |
| 2015 | $4,181 | $350,727 | $115,733 | $234,994 |
| 2014 | $4,072 | $343,857 | $113,466 | $230,391 |
Source: Public Records
Map
Nearby Homes
- 2315 Divisadero St Unit M
- 2882 Jackson St
- 2500 Divisadero St
- 2870 Sacramento St
- 2854 Sacramento St
- 2050 Divisadero St Unit 2
- 3070 Jackson St
- 2881 Vallejo St
- 3104 Sacramento St
- 2535 Vallejo St
- 2652 California St
- 2678 Sacramento St
- 2523 Steiner St
- 2684 Green St
- 2550 Baker St
- 1945 Pierce St
- 2450 Vallejo St
- 2654-2656 Bush St
- 1844 Scott St
- 2466 Union St
- 2801 Jackson St Unit 304
- 2801 Jackson St Unit 104
- 2801 Jackson St Unit 302
- 2801 Jackson St Unit 303
- 2801 Jackson St Unit 201
- 2801 Jackson St Unit 204
- 2801 Jackson St Unit 12
- 2801 Jackson St Unit 11
- 2801 Jackson St Unit 10
- 2801 Jackson St Unit 6
- 2801 Jackson St Unit 5
- 2801 Jackson St Unit 2
- 2801 Jackson St Unit 1
- 2801 Jackson St Unit 8
- 2801 Jackson St Unit 102
- 2801 Jackson St Unit 3
- 2801 Jackson St Unit 301
- 2345 Divisadero St
- 2811 Jackson St
- 2329 Divisadero St Unit 6
Your Personal Tour Guide
Ask me questions while you tour the home.