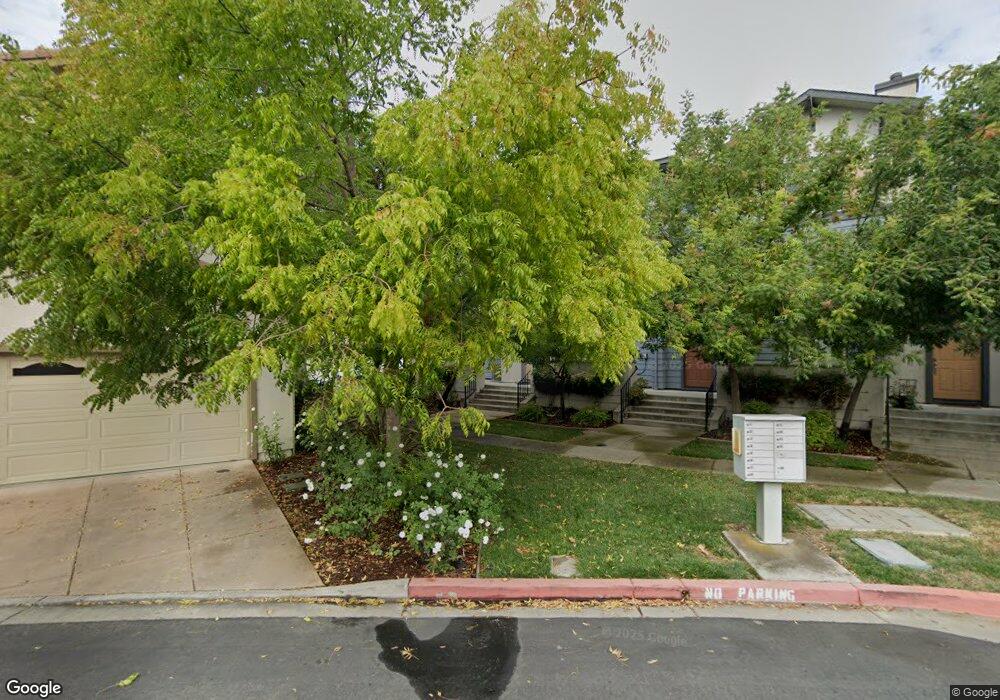
2801 Jefferson Ln Concord, CA 94519
Parkside NeighborhoodEstimated Value: $653,369 - $727,000
3
Beds
3
Baths
1,645
Sq Ft
$419/Sq Ft
Est. Value
About This Home
This home is located at 2801 Jefferson Ln, Concord, CA 94519 and is currently estimated at $688,592, approximately $418 per square foot. 2801 Jefferson Ln is a home located in Contra Costa County with nearby schools including Wren Avenue Elementary School, El Dorado Middle School, and Mt. Diablo High School.
Ownership History
Date
Name
Owned For
Owner Type
Purchase Details
Closed on
Jan 28, 2014
Sold by
Iig Properties Llc
Bought by
Persons Thomas
Current Estimated Value
Home Financials for this Owner
Home Financials are based on the most recent Mortgage that was taken out on this home.
Original Mortgage
$308,000
Outstanding Balance
$233,742
Interest Rate
4.45%
Mortgage Type
New Conventional
Estimated Equity
$454,850
Purchase Details
Closed on
Sep 19, 2013
Sold by
Guyman Robert G and Guyman Katherine M
Bought by
Ii G Properties Llc
Purchase Details
Closed on
Jun 17, 2005
Sold by
Olson 737 Concord 56 Llc
Bought by
Guyman Robert G and Guyman Katherine M
Home Financials for this Owner
Home Financials are based on the most recent Mortgage that was taken out on this home.
Original Mortgage
$476,379
Interest Rate
5.62%
Mortgage Type
New Conventional
Create a Home Valuation Report for This Property
The Home Valuation Report is an in-depth analysis detailing your home's value as well as a comparison with similar homes in the area
Home Values in the Area
Average Home Value in this Area
Purchase History
| Date | Buyer | Sale Price | Title Company |
|---|---|---|---|
| Persons Thomas | $385,000 | First American Title | |
| Ii G Properties Llc | $297,000 | None Available | |
| Guyman Robert G | $595,500 | First American Title |
Source: Public Records
Mortgage History
| Date | Status | Borrower | Loan Amount |
|---|---|---|---|
| Open | Persons Thomas | $308,000 | |
| Previous Owner | Guyman Robert G | $476,379 |
Source: Public Records
Tax History
| Year | Tax Paid | Tax Assessment Tax Assessment Total Assessment is a certain percentage of the fair market value that is determined by local assessors to be the total taxable value of land and additions on the property. | Land | Improvement |
|---|---|---|---|---|
| 2025 | $6,194 | $471,945 | $165,484 | $306,461 |
| 2024 | $5,910 | $462,692 | $162,240 | $300,452 |
| 2023 | $5,910 | $453,620 | $159,059 | $294,561 |
| 2022 | $5,823 | $444,727 | $155,941 | $288,786 |
| 2021 | $5,674 | $436,008 | $152,884 | $283,124 |
| 2019 | $5,561 | $423,077 | $148,350 | $274,727 |
| 2018 | $5,346 | $414,783 | $145,442 | $269,341 |
| 2017 | $5,163 | $406,651 | $142,591 | $264,060 |
| 2016 | $5,014 | $398,679 | $139,796 | $258,883 |
| 2015 | $4,949 | $392,692 | $137,697 | $254,995 |
| 2014 | $3,865 | $297,000 | $75,000 | $222,000 |
Source: Public Records
Map
Nearby Homes
- 1861 Parkside Dr
- 1848 Parkside Dr
- 2850 Concord Blvd
- 2601 Sinclair Ave Unit 6
- 2640 Wisteria Way
- 2947 Concord Blvd
- 2837 Bonifacio St
- 3195 Willow Pass Rd
- 3162 Salvio St
- 1954 N 6th St
- 3336 Euclid Ave
- 2093 Mount Diablo St
- 2108 Roskelley Dr
- 1385 Galindo St
- 2109 N 6th St
- 1715 Copperleaf Ct
- 1328 Mesa St
- 2105 Holbrook Dr
- 1971 Bonifacio St Unit 3
- 3124 Mount Diablo St
- 2803 Jefferson Ln
- 2805 Jefferson Ln
- 2807 Jefferson Ln
- 2802 Willow Pass Rd
- 2804 Willow Pass Rd
- 2809 Jefferson Ln
- 2806 Willow Pass Rd
- 1856 3rd St
- 2808 Willow Pass Rd
- 2810 Willow Pass Rd
- 1854 3rd St
- 2800 Jefferson Ln
- 2821 Jefferson Ln
- 2820 Willow Pass Rd
- 1869 3rd St
- 2822 Willow Pass Rd
- 2867 Euclid Ave
- 2815 Euclid Ave
- 2825 Jefferson Ln
Your Personal Tour Guide
Ask me questions while you tour the home.