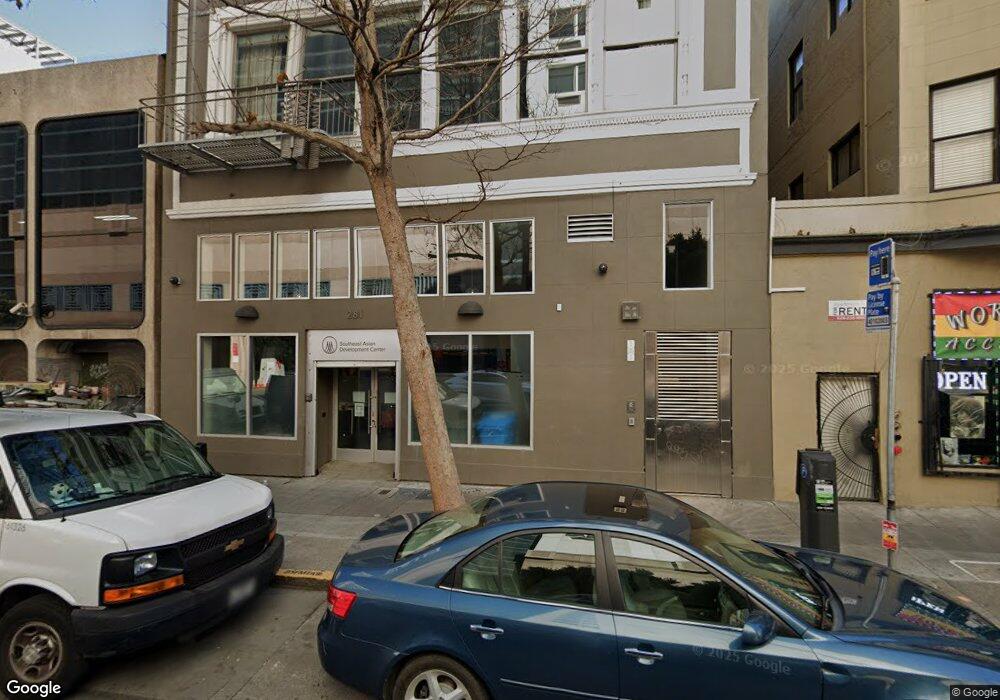
281 Ellis St San Francisco, CA 94102
Tenderloin NeighborhoodEstimated Value: $2,444,268
2
Beds
4
Baths
8,195
Sq Ft
$298/Sq Ft
Est. Value
About This Home
This home is located at 281 Ellis St, San Francisco, CA 94102 and is currently estimated at $2,444,268, approximately $298 per square foot. 281 Ellis St is a home located in San Francisco County with nearby schools including Redding Elementary School, Marina Middle School, and Creative Arts Charter School.
Ownership History
Date
Name
Owned For
Owner Type
Purchase Details
Closed on
Feb 12, 2008
Sold by
Ellis Street Venture Inc
Bought by
281 Ellis Street Llc
Current Estimated Value
Home Financials for this Owner
Home Financials are based on the most recent Mortgage that was taken out on this home.
Original Mortgage
$966,000
Outstanding Balance
$602,599
Interest Rate
5.85%
Mortgage Type
Commercial
Estimated Equity
$1,841,669
Create a Home Valuation Report for This Property
The Home Valuation Report is an in-depth analysis detailing your home's value as well as a comparison with similar homes in the area
Home Values in the Area
Average Home Value in this Area
Purchase History
| Date | Buyer | Sale Price | Title Company |
|---|---|---|---|
| 281 Ellis Street Llc | $1,390,000 | Chicago Title Company |
Source: Public Records
Mortgage History
| Date | Status | Borrower | Loan Amount |
|---|---|---|---|
| Open | 281 Ellis Street Llc | $966,000 |
Source: Public Records
Tax History Compared to Growth
Tax History
| Year | Tax Paid | Tax Assessment Tax Assessment Total Assessment is a certain percentage of the fair market value that is determined by local assessors to be the total taxable value of land and additions on the property. | Land | Improvement |
|---|---|---|---|---|
| 2025 | $28,881 | $2,286,889 | $1,372,135 | $914,754 |
| 2024 | $28,881 | $2,242,049 | $1,345,231 | $896,818 |
| 2023 | $28,410 | $2,198,088 | $1,318,854 | $879,234 |
| 2022 | $27,838 | $2,154,990 | $1,292,995 | $861,995 |
| 2021 | $28,698 | $2,112,737 | $1,267,643 | $845,094 |
| 2020 | $27,393 | $2,091,074 | $1,254,645 | $836,429 |
| 2019 | $26,461 | $2,050,074 | $1,230,045 | $820,029 |
| 2018 | $25,101 | $2,009,877 | $1,205,927 | $803,950 |
| 2017 | $24,483 | $1,970,469 | $1,182,282 | $788,187 |
| 2016 | $24,091 | $1,931,833 | $1,159,100 | $772,733 |
| 2015 | $23,783 | $1,902,816 | $1,141,690 | $761,126 |
| 2014 | $23,157 | $1,865,543 | $1,119,326 | $746,217 |
Source: Public Records
Map
Nearby Homes
- 960 Market St Unit 817
- 960 Market St Unit 807
- 960 Market St Unit 317
- 960 Market St Unit 603
- 960 Market St Unit 501
- 960 Market St Unit 715
- 960 Market St Unit 423
- 960 Market St Unit 514
- 960 Market St Unit 806
- 960 Market St Unit 808
- 960 Market St Unit 220
- 501 Taylor St
- 334 Leavenworth St
- 6 Mint Plaza Unit 900A
- 2 Mint Plaza Unit 201
- 2 Mint Plaza Unit 502
- 2 Mint Plaza Unit 207
- 666 Post St Unit 1603
- 631 Ofarrell St Unit 416
- 631 Ofarrell St Unit 610