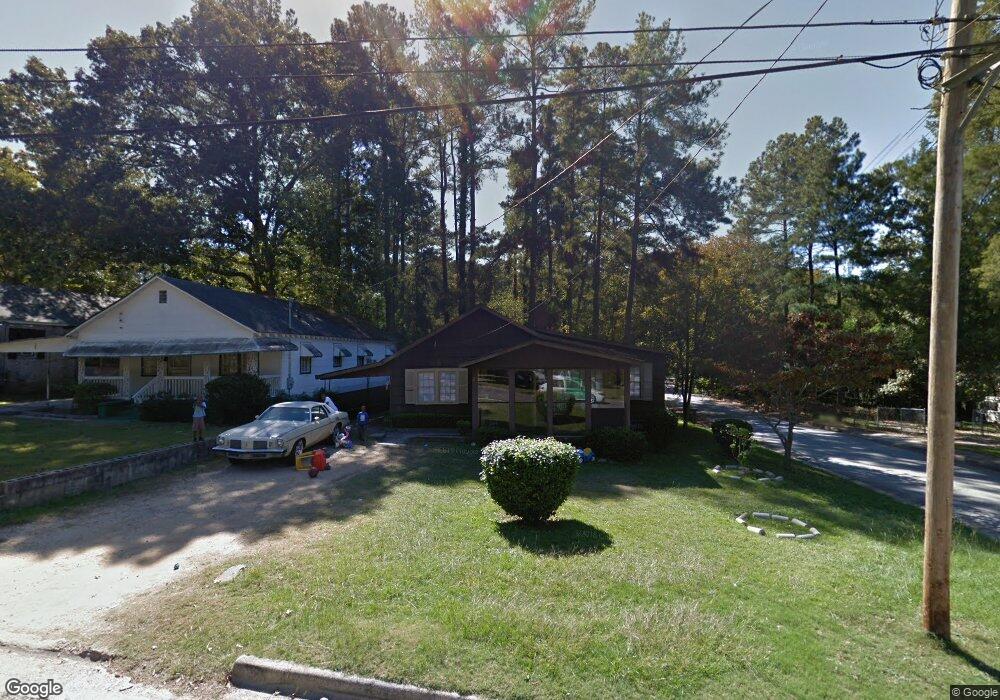
2818 Royal St Augusta, GA 30909
Sand Hills NeighborhoodEstimated Value: $119,000 - $142,511
4
Beds
2
Baths
1,512
Sq Ft
$89/Sq Ft
Est. Value
About This Home
This home is located at 2818 Royal St, Augusta, GA 30909 and is currently estimated at $135,128, approximately $89 per square foot. 2818 Royal St is a home located in Richmond County with nearby schools including Lake Forest Hills Elementary School, Tutt Middle School, and Johnson Magnet.
Ownership History
Date
Name
Owned For
Owner Type
Purchase Details
Closed on
Feb 11, 2009
Sold by
Ogrady Michael
Bought by
Jtg Partners Llc
Current Estimated Value
Purchase Details
Closed on
Nov 17, 2008
Sold by
Sec Of Hud
Bought by
O'Grady Michael
Purchase Details
Closed on
Nov 14, 2008
Sold by
Secretary Of Housing & Urban Development
Bought by
Ogrady Michael
Purchase Details
Closed on
Mar 4, 2008
Sold by
Nationwide Advantage Mortgage Co
Bought by
Hud
Purchase Details
Closed on
Jul 6, 2007
Sold by
Cadle Joseph L
Bought by
Jenkins David R
Home Financials for this Owner
Home Financials are based on the most recent Mortgage that was taken out on this home.
Original Mortgage
$62,218
Interest Rate
6.37%
Mortgage Type
FHA
Purchase Details
Closed on
Apr 19, 2002
Sold by
American General Finance Inc
Bought by
Cadle Joseph L
Purchase Details
Closed on
Jul 3, 2001
Sold by
B and Johnson Sandra E
Bought by
American General Finance Inc
Purchase Details
Closed on
Apr 23, 1990
Sold by
Johnson Daniel
Bought by
Johnson Willie Mae Johnson Jeffery
Create a Home Valuation Report for This Property
The Home Valuation Report is an in-depth analysis detailing your home's value as well as a comparison with similar homes in the area
Home Values in the Area
Average Home Value in this Area
Purchase History
| Date | Buyer | Sale Price | Title Company |
|---|---|---|---|
| Jtg Partners Llc | -- | None Available | |
| J T G Partners Llc | -- | -- | |
| O'Grady Michael | $29,000 | -- | |
| Ogrady Michael | -- | None Available | |
| Hud | -- | None Available | |
| Nationwide Advantage Mortgage Co | $66,767 | None Available | |
| Nationwide Advantage Mortgage Co | $66,800 | -- | |
| Jenkins David R | $63,200 | None Available | |
| Cadle Joseph L | $18,500 | -- | |
| American General Finance Inc | $36,307 | -- | |
| American General Finance Inc | $36,300 | -- | |
| Johnson Willie Mae Johnson Jeffery | -- | -- |
Source: Public Records
Mortgage History
| Date | Status | Borrower | Loan Amount |
|---|---|---|---|
| Previous Owner | Jenkins David R | $62,218 |
Source: Public Records
Tax History
| Year | Tax Paid | Tax Assessment Tax Assessment Total Assessment is a certain percentage of the fair market value that is determined by local assessors to be the total taxable value of land and additions on the property. | Land | Improvement |
|---|---|---|---|---|
| 2025 | $1,793 | $48,712 | $2,962 | $45,750 |
| 2024 | $1,793 | $37,912 | $2,962 | $34,950 |
| 2023 | $1,414 | $32,812 | $2,962 | $29,850 |
| 2022 | $1,542 | $40,278 | $2,962 | $37,316 |
| 2021 | $1,124 | $24,226 | $2,962 | $21,264 |
| 2020 | $1,111 | $24,226 | $2,962 | $21,264 |
| 2019 | $1,168 | $24,226 | $2,962 | $21,264 |
| 2018 | $1,176 | $24,226 | $2,962 | $21,264 |
| 2017 | $1,171 | $24,226 | $2,962 | $21,264 |
| 2016 | $1,172 | $24,226 | $2,962 | $21,264 |
| 2015 | $1,178 | $24,226 | $2,962 | $21,264 |
| 2014 | $1,179 | $24,226 | $2,962 | $21,264 |
Source: Public Records
Map
Nearby Homes
- 2816 Royal St
- 2818 Hazel St
- 2833 Hazel St
- 542 Basin St
- 543 Basin St
- 533 Basin St
- 531 Boy Scout Rd
- 2716 Hazel St
- 12 Shadowbrook Cir
- 3348 Walton Way
- 2875 Lake Forest Dr
- 3012 Langford Dr
- 552 Whitehead Dr
- 544 Highland Ave
- 4 Indian Cove Rd
- 3030 Walton Way
- 565 Martin Ln
- 520 Henderson Dr
- 568 Martin Ln
- 3011 Fox Spring Rd