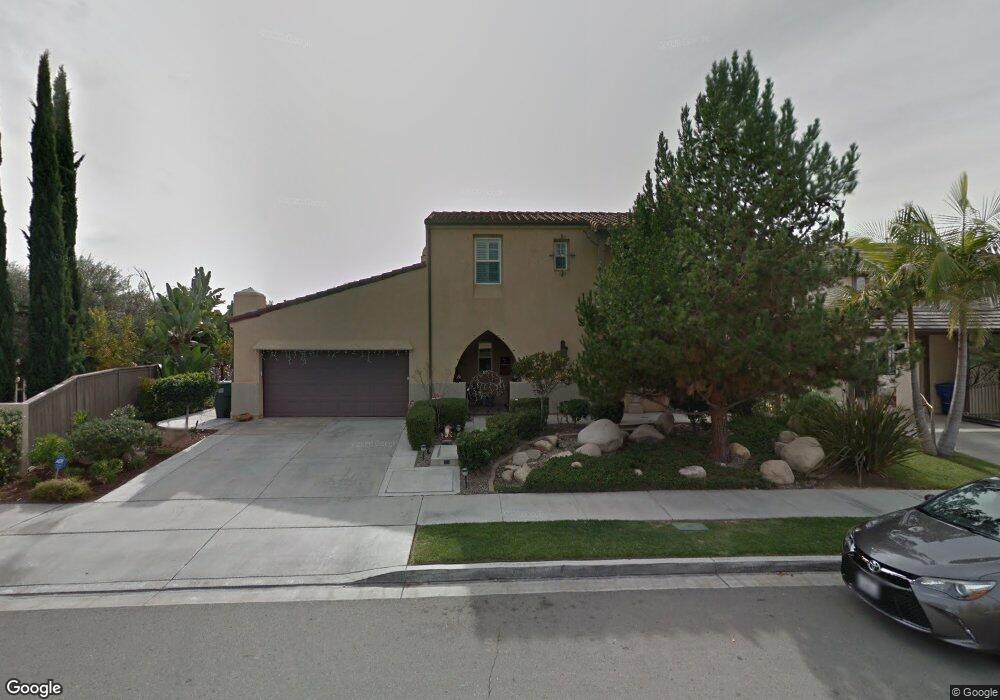
2822 Rambling Vista Rd Chula Vista, CA 91915
Eastlake NeighborhoodEstimated Value: $1,306,000 - $1,624,000
4
Beds
4
Baths
3,012
Sq Ft
$469/Sq Ft
Est. Value
About This Home
This home is located at 2822 Rambling Vista Rd, Chula Vista, CA 91915 and is currently estimated at $1,411,777, approximately $468 per square foot. 2822 Rambling Vista Rd is a home located in San Diego County with nearby schools including Salt Creek Elementary School, Eastlake Middle School, and Eastlake High School.
Ownership History
Date
Name
Owned For
Owner Type
Purchase Details
Closed on
Nov 20, 2024
Sold by
Emmanuel-Cochrane Living Trust and Emmanuel-Cochrane Joy
Bought by
Emmanuel Joy
Current Estimated Value
Home Financials for this Owner
Home Financials are based on the most recent Mortgage that was taken out on this home.
Original Mortgage
$220,000
Outstanding Balance
$218,072
Interest Rate
6.79%
Mortgage Type
Credit Line Revolving
Estimated Equity
$1,193,705
Purchase Details
Closed on
Aug 16, 2016
Sold by
Emmanuel Cochrane Joy
Bought by
Emmanuel Cochrane Joy
Home Financials for this Owner
Home Financials are based on the most recent Mortgage that was taken out on this home.
Original Mortgage
$551,000
Interest Rate
3.41%
Mortgage Type
New Conventional
Purchase Details
Closed on
Aug 12, 2015
Sold by
Emmanuel Cochrane Joy
Bought by
Emmanuel Cochrane Joy
Purchase Details
Closed on
May 19, 2015
Sold by
Cochrane Joy E and Cochrane Joy Emmanuel
Bought by
Cochrane Joy E
Home Financials for this Owner
Home Financials are based on the most recent Mortgage that was taken out on this home.
Original Mortgage
$558,959
Interest Rate
3.87%
Mortgage Type
FHA
Purchase Details
Closed on
Aug 15, 2014
Sold by
Seo Jung Youp and Kim Minjung
Bought by
Cochrane Joy Emmanuel
Home Financials for this Owner
Home Financials are based on the most recent Mortgage that was taken out on this home.
Original Mortgage
$555,809
Interest Rate
4.25%
Mortgage Type
FHA
Purchase Details
Closed on
Nov 28, 2012
Sold by
Seo Jung Youp
Bought by
Seo Jung Youp and Kim Minjung
Home Financials for this Owner
Home Financials are based on the most recent Mortgage that was taken out on this home.
Original Mortgage
$345,000
Interest Rate
3.37%
Mortgage Type
New Conventional
Purchase Details
Closed on
Mar 16, 2010
Sold by
Kim Min Jung
Bought by
Seo Jung Youp
Purchase Details
Closed on
Nov 16, 2005
Sold by
Thompson Jack C and Thompson Chantra
Bought by
Seo Jung Youp and Kim Min Jung
Home Financials for this Owner
Home Financials are based on the most recent Mortgage that was taken out on this home.
Original Mortgage
$530,000
Interest Rate
1%
Mortgage Type
Fannie Mae Freddie Mac
Purchase Details
Closed on
Aug 25, 2003
Sold by
Dw Chula Vista Lp
Bought by
Thompson Jack C and Thompson Chantra
Home Financials for this Owner
Home Financials are based on the most recent Mortgage that was taken out on this home.
Original Mortgage
$428,800
Interest Rate
5.89%
Mortgage Type
Stand Alone First
Create a Home Valuation Report for This Property
The Home Valuation Report is an in-depth analysis detailing your home's value as well as a comparison with similar homes in the area
Home Values in the Area
Average Home Value in this Area
Purchase History
| Date | Buyer | Sale Price | Title Company |
|---|---|---|---|
| Emmanuel Joy | -- | Ticor Title | |
| Emmanuel Cochrane Joy | -- | Accommodation | |
| Emmanuel Cochrane Joy | -- | Corinthian Title Company | |
| Emmanuel Cochrane Joy | -- | None Available | |
| Cochrane Joy E | -- | Corinthian Title Company | |
| Cochrane Joy Emmanuel | $630,000 | Corinthian Title Company | |
| Seo Jung Youp | -- | Provident Title Company | |
| Seo Jung Youp | -- | None Available | |
| Seo Jung Youp | $880,000 | Fidelity National Title San | |
| Thompson Jack C | $553,500 | First American Title Ins Co |
Source: Public Records
Mortgage History
| Date | Status | Borrower | Loan Amount |
|---|---|---|---|
| Open | Emmanuel Joy | $220,000 | |
| Previous Owner | Emmanuel Cochrane Joy | $551,000 | |
| Previous Owner | Cochrane Joy E | $558,959 | |
| Previous Owner | Cochrane Joy Emmanuel | $555,809 | |
| Previous Owner | Seo Jung Youp | $345,000 | |
| Previous Owner | Seo Jung Youp | $530,000 | |
| Previous Owner | Thompson Jack C | $428,800 |
Source: Public Records
Tax History Compared to Growth
Tax History
| Year | Tax Paid | Tax Assessment Tax Assessment Total Assessment is a certain percentage of the fair market value that is determined by local assessors to be the total taxable value of land and additions on the property. | Land | Improvement |
|---|---|---|---|---|
| 2025 | $11,240 | $757,156 | $360,350 | $396,806 |
| 2024 | $11,240 | $742,311 | $353,285 | $389,026 |
| 2023 | $11,207 | $727,757 | $346,358 | $381,399 |
| 2022 | $10,885 | $713,488 | $339,567 | $373,921 |
| 2021 | $10,656 | $699,499 | $332,909 | $366,590 |
| 2020 | $10,423 | $692,328 | $329,496 | $362,832 |
| 2019 | $10,178 | $678,754 | $323,036 | $355,718 |
| 2018 | $10,031 | $665,446 | $316,702 | $348,744 |
| 2017 | $9,864 | $652,399 | $310,493 | $341,906 |
| 2016 | $9,514 | $639,607 | $304,405 | $335,202 |
| 2015 | $9,335 | $630,000 | $299,833 | $330,167 |
| 2014 | $8,452 | $540,000 | $257,000 | $283,000 |
Source: Public Records
Map
Nearby Homes
- 2814 Rambling Vista Rd
- 2792 Rambling Vista Rd
- 1436 Horn Canyon Ave
- 1461 Agate Creek Way
- 1427 Marble Canyon Way
- 2832 Echo Ridge Ct
- 2796 Bear Valley Rd
- 2744 Rambling Vista Rd
- 2993 Weeping Willow Rd
- 1505 Laurel Grove Dr Unit 3
- 2816 Weeping Willow Rd
- 1328 N Paradise Ridge Way
- 2850 Palmetto Point Ct
- 2721 Castlehill Rd Unit 1
- 1512 Champion Ln Unit 4
- 2754 Silver Medal Rd Unit 1
- 1515 Crown Ln Unit 6
- 2840 Athens Rd Unit 10
- 2890 Silver Medal Rd Unit 2
- 2710 Sparta Rd Unit 10
- 2818 Rambling Vista Rd
- 1430 Agate Creek Way
- 2825 Red Rock Canyon Rd
- 1434 Agate Creek Way
- 2829 Red Rock Canyon Rd
- 2821 Red Rock Canyon Rd
- 1438 Agate Creek Way
- 2821 Rambling Vista Rd
- 2825 Rambling Vista Rd
- 2815 Rambling Vista Rd
- 2813 Red Rock Canyon Rd
- 2833 Red Rock Canyon Rd
- 2829 Rambling Vista Rd
- 2810 Rambling Vista Rd
- 1442 Agate Creek Way
- 2809 Red Rock Canyon Rd
- 2811 Rambling Vista Rd
- 2837 Red Rock Canyon Rd
- 1431 Agate Creek Way
- 2833 Rambling Vista Rd