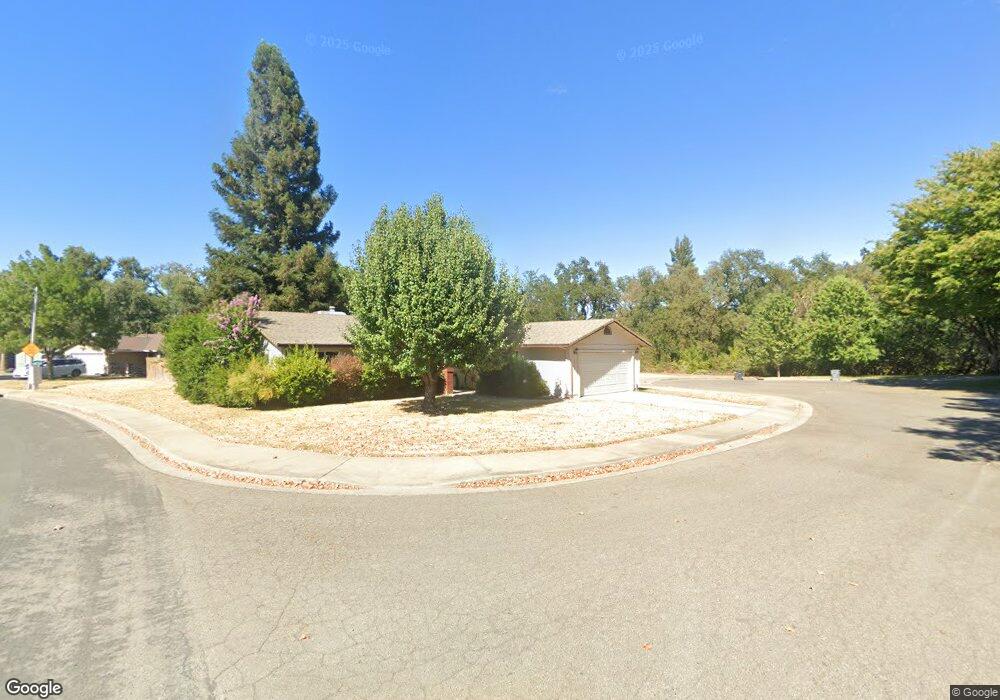
2826 Hemlock Ct Redding, CA 96001
Girvan NeighborhoodEstimated Value: $318,390 - $343,000
3
Beds
2
Baths
1,340
Sq Ft
$246/Sq Ft
Est. Value
About This Home
This home is located at 2826 Hemlock Ct, Redding, CA 96001 and is currently estimated at $330,098, approximately $246 per square foot. 2826 Hemlock Ct is a home located in Shasta County with nearby schools including Bonny View Elementary School, Sequoia Middle School, and Shasta High School.
Ownership History
Date
Name
Owned For
Owner Type
Purchase Details
Closed on
Oct 24, 2012
Sold by
Neilson Chad Wayne and Neilson Che Childers
Bought by
Neilson Chad W and Neilson Che C
Current Estimated Value
Home Financials for this Owner
Home Financials are based on the most recent Mortgage that was taken out on this home.
Original Mortgage
$158,593
Outstanding Balance
$109,769
Interest Rate
3.5%
Mortgage Type
VA
Estimated Equity
$220,329
Purchase Details
Closed on
Feb 28, 2011
Sold by
Mau Muriel G
Bought by
Neilson Chad Wayne and Neilson Che Childers
Home Financials for this Owner
Home Financials are based on the most recent Mortgage that was taken out on this home.
Original Mortgage
$161,500
Interest Rate
4.71%
Mortgage Type
VA
Purchase Details
Closed on
Nov 21, 2006
Sold by
Mau Muriel G
Bought by
Mau Muriel G
Purchase Details
Closed on
Jul 5, 2006
Sold by
Visser Martin Jon and Visser Lori
Bought by
Mau Muriel G
Create a Home Valuation Report for This Property
The Home Valuation Report is an in-depth analysis detailing your home's value as well as a comparison with similar homes in the area
Home Values in the Area
Average Home Value in this Area
Purchase History
| Date | Buyer | Sale Price | Title Company |
|---|---|---|---|
| Neilson Chad W | -- | First American Title Company | |
| Neilson Chad Wayne | $161,500 | Placer Title Company | |
| Mau Muriel G | -- | None Available | |
| Mau Muriel G | $265,000 | Alliance Title Company |
Source: Public Records
Mortgage History
| Date | Status | Borrower | Loan Amount |
|---|---|---|---|
| Open | Neilson Chad W | $158,593 | |
| Closed | Neilson Chad Wayne | $161,500 |
Source: Public Records
Tax History
| Year | Tax Paid | Tax Assessment Tax Assessment Total Assessment is a certain percentage of the fair market value that is determined by local assessors to be the total taxable value of land and additions on the property. | Land | Improvement |
|---|---|---|---|---|
| 2025 | $2,083 | $206,896 | $76,865 | $130,031 |
| 2024 | $2,050 | $202,840 | $75,358 | $127,482 |
| 2023 | $2,050 | $198,864 | $73,881 | $124,983 |
| 2022 | $2,014 | $194,966 | $72,433 | $122,533 |
| 2021 | $2,002 | $191,144 | $71,013 | $120,131 |
| 2020 | $2,028 | $189,185 | $70,285 | $118,900 |
| 2019 | $1,924 | $185,476 | $68,907 | $116,569 |
| 2018 | $1,940 | $181,840 | $67,556 | $114,284 |
| 2017 | $1,928 | $178,276 | $66,232 | $112,044 |
| 2016 | $1,865 | $174,782 | $64,934 | $109,848 |
| 2015 | $1,840 | $172,157 | $63,959 | $108,198 |
| 2014 | $1,729 | $160,000 | $50,000 | $110,000 |
Source: Public Records
Map
Nearby Homes
- 6871 Hemlock St
- 7022 Marvin Trail
- 6955 Yvonne Ct
- 7060 Pit Rd
- 7253 Legacy
- 0 Waverly Manor
- 7420 Platinum Way
- 6725 Reflection St
- 2850 Balaton Ave
- 2890 Balaton Ave
- 3182 Island Dr
- 6733 El Camino Dr
- 6958 Riverside Dr
- 6551 El Camino Dr
- 7035 Riverside Dr
- 6681 Riverside Dr
- 7728 Pit Rd
- 6624 Southgate Dr
- 6405 El Camino Dr
- 2339 North Dr
- 2854 Hemlock Ct
- 6887 Hemlock St
- 2813 Hemlock Ct
- 6898 Hemlock St
- 6892 Hemlock St
- 6885 Hemlock St
- 2841 Hemlock Ct
- 6926 Hemlock St
- 6878 Hemlock St
- 6951 Hemlock St
- 2869 Hemlock Ct
- 6948 Hemlock St
- 6866 Hemlock St
- 6942 Marvin Tr
- 6942 Marvin Trail Unit one
- 6942 Marvin Trail
- 6969 Hemlock St
- 6918 Meadow Wood Trail
- 6853 Hemlock St
- 6964 Hemlock St
Your Personal Tour Guide
Ask me questions while you tour the home.