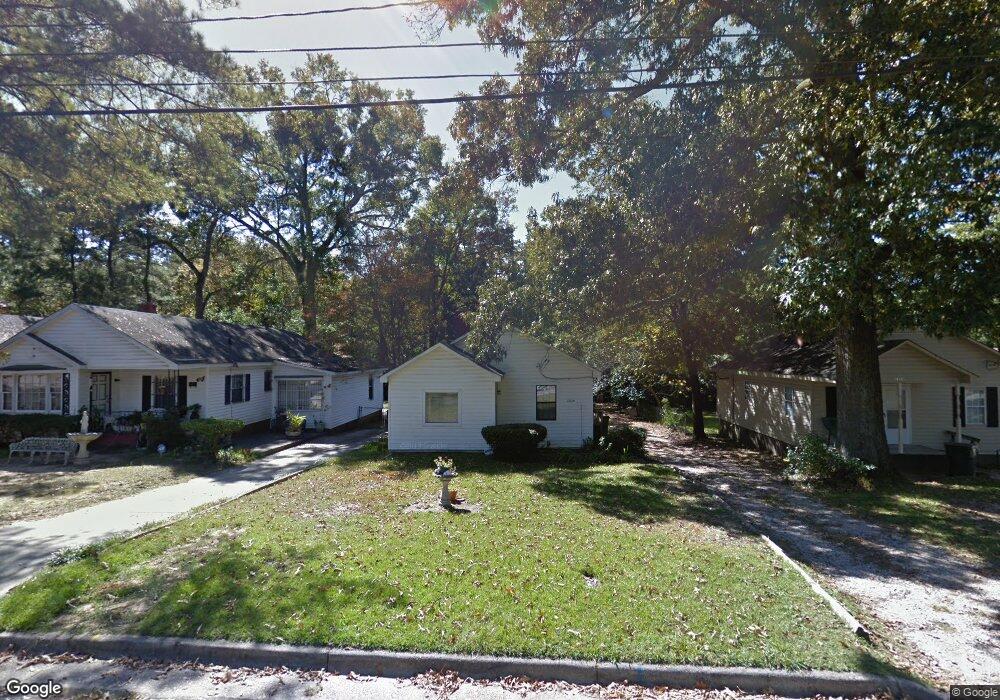
2826 Royal St Augusta, GA 30909
Sand Hills NeighborhoodEstimated Value: $69,000 - $123,000
2
Beds
1
Bath
840
Sq Ft
$113/Sq Ft
Est. Value
About This Home
This home is located at 2826 Royal St, Augusta, GA 30909 and is currently estimated at $94,804, approximately $112 per square foot. 2826 Royal St is a home located in Richmond County with nearby schools including First Coast Technical Institute, R.B. Hunt Elementary School, and Lake Forest Hills Elementary School.
Ownership History
Date
Name
Owned For
Owner Type
Purchase Details
Closed on
Jan 17, 2000
Sold by
Cadle Joseph and Cadle Nancy E
Bought by
Coleman Elisa R
Current Estimated Value
Home Financials for this Owner
Home Financials are based on the most recent Mortgage that was taken out on this home.
Original Mortgage
$40,089
Outstanding Balance
$12,588
Interest Rate
7.9%
Mortgage Type
FHA
Estimated Equity
$82,216
Purchase Details
Closed on
Aug 30, 1999
Sold by
Trottie Willie J and Brown Thelma
Bought by
Associates Home Equity Services Inc and Ford Consumer Finance Company Inc
Purchase Details
Closed on
Oct 27, 1995
Sold by
Brown Antonie C
Bought by
Trottie Willie J
Purchase Details
Closed on
Oct 26, 1993
Sold by
Brown Antonie C
Bought by
Trottie Willie J
Purchase Details
Closed on
Nov 10, 1992
Sold by
Mcgahee C William
Bought by
Brown Antoine C Brown Thelma
Purchase Details
Closed on
Nov 6, 1992
Sold by
Mcgahee C William
Bought by
Brown Antoine C
Create a Home Valuation Report for This Property
The Home Valuation Report is an in-depth analysis detailing your home's value as well as a comparison with similar homes in the area
Home Values in the Area
Average Home Value in this Area
Purchase History
| Date | Buyer | Sale Price | Title Company |
|---|---|---|---|
| Coleman Elisa R | $39,900 | -- | |
| Associates Home Equity Services Inc | -- | -- | |
| Cadle Joseph | $14,000 | -- | |
| Trottie Willie J | -- | -- | |
| Trottie Willie J | -- | -- | |
| Brown Antoine C Brown Thelma | -- | -- | |
| Brown Antoine C | $16,500 | -- |
Source: Public Records
Mortgage History
| Date | Status | Borrower | Loan Amount |
|---|---|---|---|
| Open | Coleman Elisa R | $40,089 | |
| Closed | Coleman Elisa R | $2,109 |
Source: Public Records
Tax History Compared to Growth
Tax History
| Year | Tax Paid | Tax Assessment Tax Assessment Total Assessment is a certain percentage of the fair market value that is determined by local assessors to be the total taxable value of land and additions on the property. | Land | Improvement |
|---|---|---|---|---|
| 2025 | $1,632 | $29,320 | $2,962 | $26,358 |
| 2024 | $1,632 | $23,784 | $2,962 | $20,822 |
| 2023 | $1,125 | $32,304 | $2,962 | $29,342 |
| 2022 | $1,085 | $25,337 | $2,962 | $22,375 |
| 2021 | $835 | $15,610 | $2,962 | $12,648 |
| 2020 | $826 | $15,610 | $2,962 | $12,648 |
| 2019 | $863 | $15,610 | $2,962 | $12,648 |
| 2018 | $868 | $15,610 | $2,962 | $12,648 |
| 2017 | $865 | $15,610 | $2,962 | $12,648 |
| 2016 | $865 | $15,610 | $2,962 | $12,648 |
| 2015 | $869 | $15,610 | $2,962 | $12,648 |
| 2014 | $870 | $15,610 | $2,962 | $12,648 |
Source: Public Records
Map
Nearby Homes
- 2818 Hazel St
- 542 Basin St
- 543 Basin St
- 533 Basin St
- 2823 Walters Ct
- 2923 Henry St
- 2716 Hazel St
- 12 Shadowbrook Cir
- 2713 Hazel St
- 3348 Walton Way
- 2875 Lake Forest Dr
- 814 Windsor Ct
- 552 Whitehead Dr
- 3012 Walton Way
- 565 Martin Ln
- 712 Westminster Ct
- 904 Highland Ave
- 525 Henderson Dr
- 3011 Fox Spring Rd
- 2711 Wellington Dr