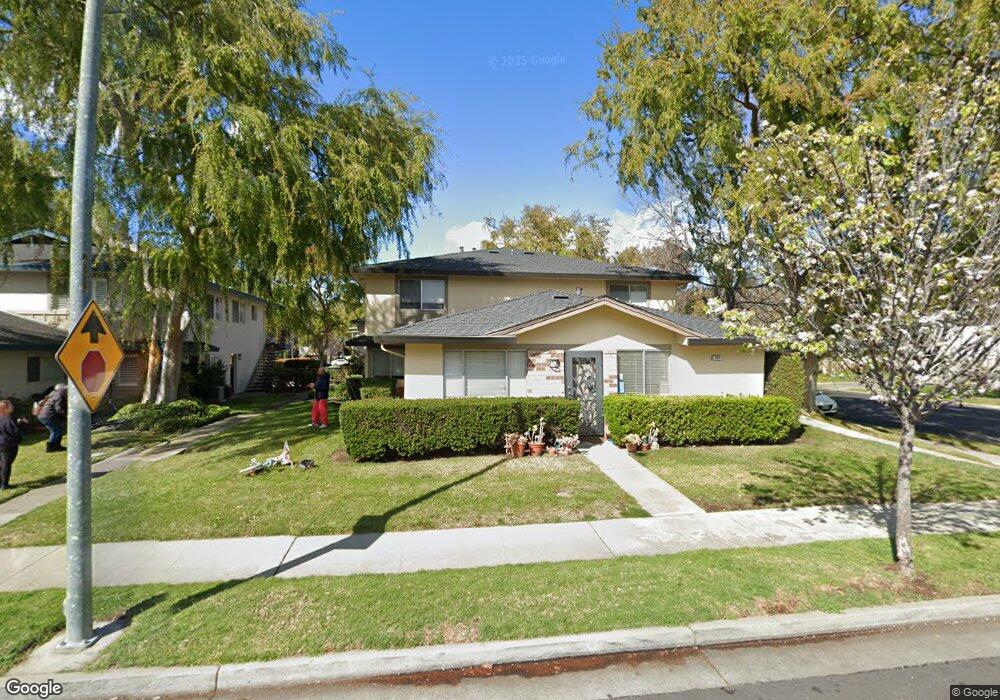
283 E Latimer Ave Unit 3 Campbell, CA 95008
Downtown Campbell NeighborhoodEstimated Value: $657,699 - $880,000
2
Beds
1
Bath
903
Sq Ft
$809/Sq Ft
Est. Value
About This Home
This home is located at 283 E Latimer Ave Unit 3, Campbell, CA 95008 and is currently estimated at $730,675, approximately $809 per square foot. 283 E Latimer Ave Unit 3 is a home located in Santa Clara County with nearby schools including Rosemary Elementary School, Del Mar High School, and Campbell School of Innovation.
Ownership History
Date
Name
Owned For
Owner Type
Purchase Details
Closed on
Mar 27, 2018
Sold by
Schmidt Paul
Bought by
Schmidt Paul and Paul Schmidt 2018 Trust
Current Estimated Value
Purchase Details
Closed on
Mar 20, 2007
Sold by
Christensen Morten and Christensen Lupe
Bought by
Schmidt Paul
Home Financials for this Owner
Home Financials are based on the most recent Mortgage that was taken out on this home.
Original Mortgage
$7,500
Outstanding Balance
$4,547
Interest Rate
6.2%
Mortgage Type
Unknown
Estimated Equity
$726,128
Purchase Details
Closed on
Jul 14, 2004
Sold by
Uchimoto Warren
Bought by
Christensen Morten and Christensen Lupe
Home Financials for this Owner
Home Financials are based on the most recent Mortgage that was taken out on this home.
Original Mortgage
$240,000
Interest Rate
6.27%
Mortgage Type
Purchase Money Mortgage
Create a Home Valuation Report for This Property
The Home Valuation Report is an in-depth analysis detailing your home's value as well as a comparison with similar homes in the area
Home Values in the Area
Average Home Value in this Area
Purchase History
| Date | Buyer | Sale Price | Title Company |
|---|---|---|---|
| Schmidt Paul | -- | None Available | |
| Schmidt Paul | $410,000 | Stewart Title Of Ca Inc | |
| Christensen Morten | $300,000 | First American Title Company |
Source: Public Records
Mortgage History
| Date | Status | Borrower | Loan Amount |
|---|---|---|---|
| Open | Schmidt Paul | $7,500 | |
| Open | Schmidt Paul | $183,700 | |
| Previous Owner | Christensen Morten | $240,000 | |
| Closed | Christensen Morten | $45,000 |
Source: Public Records
Tax History
| Year | Tax Paid | Tax Assessment Tax Assessment Total Assessment is a certain percentage of the fair market value that is determined by local assessors to be the total taxable value of land and additions on the property. | Land | Improvement |
|---|---|---|---|---|
| 2025 | $7,409 | $549,300 | $274,650 | $274,650 |
| 2024 | $7,409 | $538,530 | $269,265 | $269,265 |
| 2023 | $7,313 | $527,972 | $263,986 | $263,986 |
| 2022 | $7,308 | $517,620 | $258,810 | $258,810 |
| 2021 | $7,166 | $507,472 | $253,736 | $253,736 |
| 2020 | $6,972 | $502,270 | $251,135 | $251,135 |
| 2019 | $6,865 | $492,422 | $246,211 | $246,211 |
| 2018 | $6,649 | $482,768 | $241,384 | $241,384 |
| 2017 | $6,461 | $473,302 | $236,651 | $236,651 |
| 2016 | $6,069 | $464,022 | $232,011 | $232,011 |
| 2015 | $5,615 | $428,000 | $214,000 | $214,000 |
| 2014 | $5,139 | $399,000 | $199,500 | $199,500 |
Source: Public Records
Map
Nearby Homes
- 350 N 1st St Unit 3
- 283 Esther Ave
- 77 S 1st St
- 1481 Pompey Dr
- 110 S 1st St Unit 110
- 1454 Merry Ln
- 466 Sam Cava Ln
- 87 Salice Way
- 136 Lottie Ln
- 101 Sunnyside Ave
- 206 Sunnyside Ave
- 143 Kennedy Ave
- 186 W Rincon Ave
- 188 W Rincon Ave
- 63 Braxton Terrace
- 75 Union Ave Unit 5
- 1460 Regalo Ct
- 137 Union Ave Unit A
- 133 Union Ave Unit F
- 185 Union Ave Unit 78
- 283 E Latimer Ave Unit 4
- 283 E Latimer Ave Unit 2
- 283 E Latimer Ave Unit 1
- 263 E Latimer Ave Unit 4
- 263 E Latimer Ave Unit 3
- 263 E Latimer Ave Unit 2
- 263 E Latimer Ave Unit 1
- 305 N 2nd St Unit 4
- 305 N 2nd St Unit 3
- 305 N 2nd St Unit 2
- 305 N 2nd St Unit 1
- 323 E Latimer Ave Unit 4
- 323 E Latimer Ave Unit 3
- 323 E Latimer Ave Unit 1
- 243 E Latimer Ave Unit 4
- 243 E Latimer Ave Unit 3
- 243 E Latimer Ave Unit 2
- 243 E Latimer Ave Unit 1
- 311 N 2nd St Unit 4
- 311 N 2nd St Unit 3
Your Personal Tour Guide
Ask me questions while you tour the home.