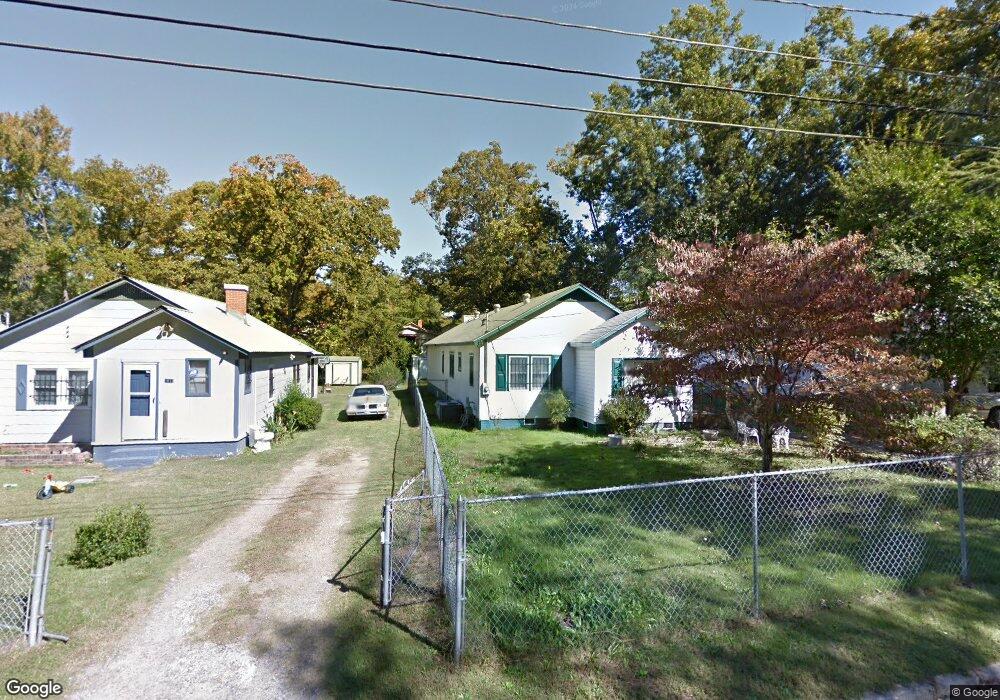
2831 Hazel St Augusta, GA 30909
Sand Hills NeighborhoodEstimated Value: $147,000 - $202,000
3
Beds
2
Baths
1,704
Sq Ft
$99/Sq Ft
Est. Value
About This Home
This home is located at 2831 Hazel St, Augusta, GA 30909 and is currently estimated at $169,092, approximately $99 per square foot. 2831 Hazel St is a home located in Richmond County with nearby schools including Lake Forest Hills Elementary School, Tutt Middle School, and Johnson Magnet.
Ownership History
Date
Name
Owned For
Owner Type
Purchase Details
Closed on
Jan 11, 2021
Sold by
Jordan Bessie Jean
Bought by
Jordan Robert Willie and Williams Cathy Ponder
Current Estimated Value
Purchase Details
Closed on
Oct 8, 2014
Sold by
Jordan Life Jean Ponder
Bought by
Jordan Life Jean Ponder and Dixon Beverly
Purchase Details
Closed on
Apr 18, 2013
Sold by
Jordan Jean Ponder
Bought by
Pinkston Brenda Joyce Ponder L and Ponder Cathy
Purchase Details
Closed on
Apr 16, 2013
Sold by
Jordan Jean Ponder
Bought by
Jordan Jean Ponder L and Jordan Est
Purchase Details
Closed on
Nov 16, 2012
Sold by
Jordan Bessie Jean
Bought by
Ponder Pinkston Brenda Joyce
Purchase Details
Closed on
Nov 6, 2012
Sold by
Jordan Robert Willie
Bought by
Pinkston Brenda Joyce Ponder
Purchase Details
Closed on
Apr 16, 1993
Sold by
Jordan Robert Willie and Jordan Est
Bought by
Jordan Jean Ponder
Create a Home Valuation Report for This Property
The Home Valuation Report is an in-depth analysis detailing your home's value as well as a comparison with similar homes in the area
Home Values in the Area
Average Home Value in this Area
Purchase History
| Date | Buyer | Sale Price | Title Company |
|---|---|---|---|
| Jordan Robert Willie | -- | -- | |
| Jordan Life Jean Ponder | -- | -- | |
| Pinkston Brenda Joyce Ponder L | -- | -- | |
| Jordan Jean Ponder L | -- | -- | |
| Ponder Pinkston Brenda Joyce | -- | -- | |
| Pinkston Brenda Joyce Ponder | -- | -- | |
| Jordan Jean Ponder | -- | -- |
Source: Public Records
Tax History
| Year | Tax Paid | Tax Assessment Tax Assessment Total Assessment is a certain percentage of the fair market value that is determined by local assessors to be the total taxable value of land and additions on the property. | Land | Improvement |
|---|---|---|---|---|
| 2025 | $910 | $61,568 | $2,962 | $58,606 |
| 2024 | $910 | $53,252 | $2,962 | $50,290 |
| 2023 | $523 | $46,704 | $2,962 | $43,742 |
| 2022 | $746 | $43,668 | $2,962 | $40,706 |
| 2021 | $549 | $26,482 | $2,962 | $23,520 |
| 2020 | $551 | $26,482 | $2,962 | $23,520 |
| 2019 | $504 | $26,482 | $2,962 | $23,520 |
| 2018 | $570 | $26,482 | $2,962 | $23,520 |
| 2017 | $571 | $26,482 | $2,962 | $23,520 |
| 2016 | $565 | $26,122 | $2,962 | $23,160 |
| 2015 | $565 | $26,122 | $2,962 | $23,160 |
| 2014 | $1,247 | $26,122 | $2,962 | $23,160 |
Source: Public Records
Map
Nearby Homes
- 2833 Hazel St
- 2816 Royal St
- 542 Basin St
- 543 Basin St
- 531 Martin Ln
- 533 Basin St
- 531 Boy Scout Rd
- 3012 Langford Dr
- 2716 Hazel St
- 3348 Walton Way
- 552 Whitehead Dr
- 3030 Walton Way
- 565 Martin Ln
- 568 Martin Ln
- 4 Indian Cove Rd
- 3011 Fox Spring Rd
- 520 Henderson Dr
- 481 Boy Scout Rd
- 519 Ashland Dr
- 1210 Peachtree Rd
Your Personal Tour Guide
Ask me questions while you tour the home.