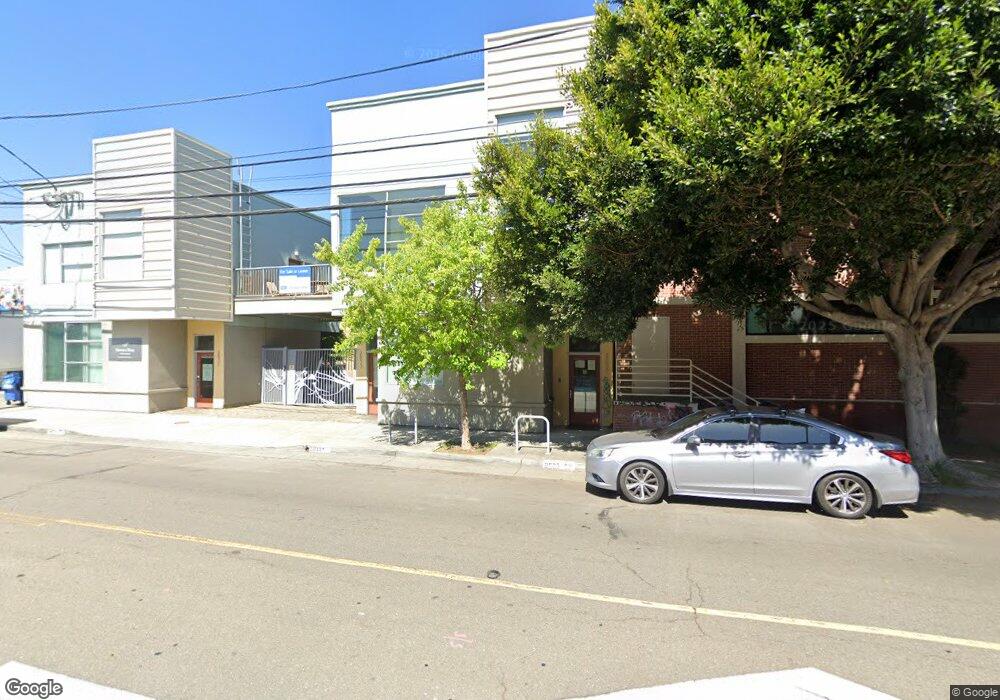
2835 7th St Berkeley, CA 94710
West Berkeley NeighborhoodEstimated Value: $1,056,415
Studio
1
Bath
2,132
Sq Ft
$496/Sq Ft
Est. Value
About This Home
This home is located at 2835 7th St, Berkeley, CA 94710 and is currently estimated at $1,056,415, approximately $495 per square foot. 2835 7th St is a home located in Alameda County with nearby schools including Malcolm X Elementary School, Oxford Elementary School, and Washington Elementary School.
Ownership History
Date
Name
Owned For
Owner Type
Purchase Details
Closed on
Sep 5, 2014
Sold by
Blair Stacie Lain
Bought by
Ckgk Llc
Current Estimated Value
Home Financials for this Owner
Home Financials are based on the most recent Mortgage that was taken out on this home.
Original Mortgage
$521,800
Outstanding Balance
$398,733
Interest Rate
4.09%
Mortgage Type
Commercial
Estimated Equity
$657,682
Purchase Details
Closed on
Jun 15, 2012
Sold by
Seventh Street Development Associates Ll
Bought by
Blair Stacie Lain
Home Financials for this Owner
Home Financials are based on the most recent Mortgage that was taken out on this home.
Original Mortgage
$239,500
Interest Rate
3.74%
Mortgage Type
Commercial
Create a Home Valuation Report for This Property
The Home Valuation Report is an in-depth analysis detailing your home's value as well as a comparison with similar homes in the area
Home Values in the Area
Average Home Value in this Area
Purchase History
| Date | Buyer | Sale Price | Title Company |
|---|---|---|---|
| Ckgk Llc | $600,000 | Old Republic Title Company | |
| Blair Stacie Lain | $479,000 | Old Republic Title Company |
Source: Public Records
Mortgage History
| Date | Status | Borrower | Loan Amount |
|---|---|---|---|
| Open | Ckgk Llc | $521,800 | |
| Previous Owner | Blair Stacie Lain | $239,500 |
Source: Public Records
Tax History
| Year | Tax Paid | Tax Assessment Tax Assessment Total Assessment is a certain percentage of the fair market value that is determined by local assessors to be the total taxable value of land and additions on the property. | Land | Improvement |
|---|---|---|---|---|
| 2025 | $11,079 | $721,085 | $180,271 | $540,814 |
| 2024 | $11,079 | $706,949 | $176,737 | $530,212 |
| 2023 | $10,847 | $693,089 | $173,272 | $519,817 |
| 2022 | $10,652 | $679,500 | $169,875 | $509,625 |
| 2021 | $10,660 | $666,180 | $166,545 | $499,635 |
| 2020 | $10,023 | $659,352 | $164,838 | $494,514 |
| 2019 | $9,718 | $646,428 | $161,607 | $484,821 |
| 2018 | $9,558 | $633,756 | $158,439 | $475,317 |
| 2017 | $9,083 | $621,329 | $155,332 | $465,997 |
| 2016 | $8,976 | $609,149 | $152,287 | $456,862 |
| 2015 | $8,949 | $600,000 | $150,000 | $450,000 |
| 2014 | $7,725 | $490,797 | $122,955 | $367,842 |
Source: Public Records
Map
Nearby Homes
- 1010 Grayson St
- 1034 Grayson St
- 811 Folger Ave
- 2751 Wallace St
- 1237 Ashby Ave
- 2717 Mabel St
- 1200 65th St Unit 224
- 1200 65th St Unit 230
- 1092 Dwight Way
- 1080 67th St
- 3032 Mabel St
- 1314 Ashby Ave
- 1118 Dwight Way
- 6501 San Pablo Ave Unit 410
- 1142 Dwight Way
- 2411 Sixth St
- 1144 Dwight Way
- 6466 Hollis St Unit 242
- 6466 Hollis St Unit 248
- 6500 San Pablo Ave
Your Personal Tour Guide
Ask me questions while you tour the home.