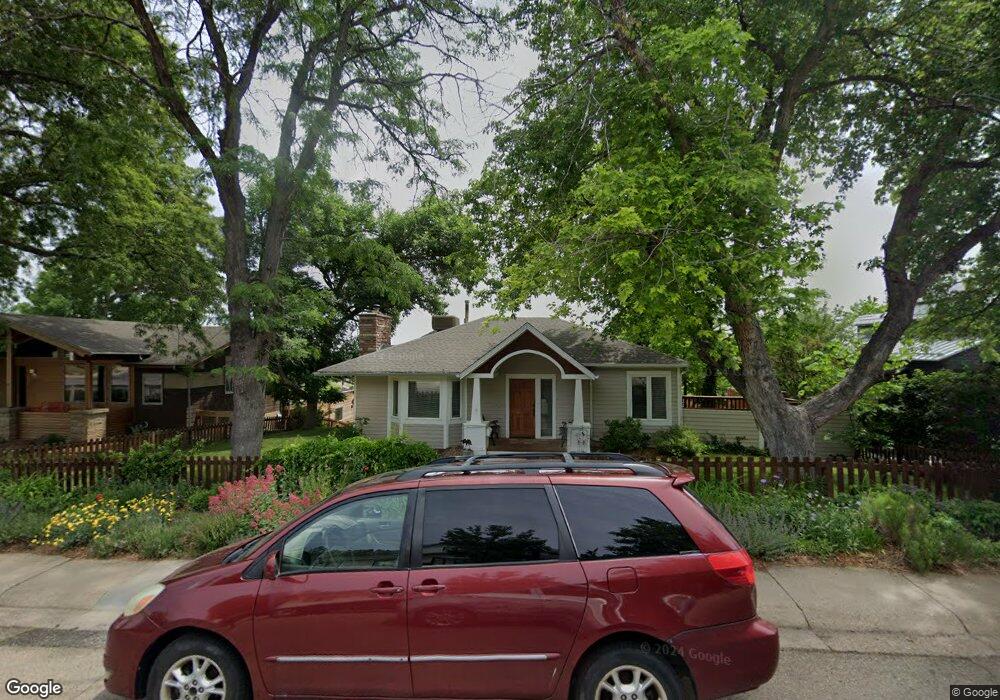
2838 4th St Boulder, CO 80304
Newlands NeighborhoodEstimated Value: $2,033,000 - $3,012,000
3
Beds
3
Baths
3,200
Sq Ft
$727/Sq Ft
Est. Value
About This Home
This home is located at 2838 4th St, Boulder, CO 80304 and is currently estimated at $2,327,427, approximately $727 per square foot. 2838 4th St is a home located in Boulder County with nearby schools including Foothill Elementary School, Casey Middle School, and Boulder High School.
Ownership History
Date
Name
Owned For
Owner Type
Purchase Details
Closed on
Mar 3, 2008
Sold by
Jacob Mitchell J and Brenton Laura L
Bought by
Brenton Laura L
Current Estimated Value
Purchase Details
Closed on
Feb 28, 2000
Sold by
Echo Hill Development Llc
Bought by
Jacob Mitchell J
Home Financials for this Owner
Home Financials are based on the most recent Mortgage that was taken out on this home.
Original Mortgage
$468,000
Outstanding Balance
$149,584
Interest Rate
7.5%
Estimated Equity
$2,177,843
Purchase Details
Closed on
Jun 19, 1998
Sold by
Henningsen Gail R and Henningsen George H
Bought by
Connolly Edward C
Home Financials for this Owner
Home Financials are based on the most recent Mortgage that was taken out on this home.
Original Mortgage
$227,500
Interest Rate
7.08%
Mortgage Type
Balloon
Purchase Details
Closed on
Nov 5, 1993
Sold by
Meier Barbara and Barkin John Neil
Bought by
Henningsen Gail R
Home Financials for this Owner
Home Financials are based on the most recent Mortgage that was taken out on this home.
Original Mortgage
$188,000
Interest Rate
6.88%
Create a Home Valuation Report for This Property
The Home Valuation Report is an in-depth analysis detailing your home's value as well as a comparison with similar homes in the area
Home Values in the Area
Average Home Value in this Area
Purchase History
| Date | Buyer | Sale Price | Title Company |
|---|---|---|---|
| Brenton Laura L | -- | None Available | |
| Jacob Mitchell J | $585,000 | Land Title | |
| Connolly Edward C | $325,000 | First American Heritage Titl | |
| Henningsen Gail R | $235,000 | -- |
Source: Public Records
Mortgage History
| Date | Status | Borrower | Loan Amount |
|---|---|---|---|
| Open | Jacob Mitchell J | $468,000 | |
| Previous Owner | Connolly Edward C | $227,500 | |
| Previous Owner | Henningsen Gail R | $188,000 |
Source: Public Records
Tax History
| Year | Tax Paid | Tax Assessment Tax Assessment Total Assessment is a certain percentage of the fair market value that is determined by local assessors to be the total taxable value of land and additions on the property. | Land | Improvement |
|---|---|---|---|---|
| 2025 | $13,866 | $140,100 | $105,444 | $34,656 |
| 2024 | $13,866 | $140,100 | $105,444 | $34,656 |
| 2023 | $13,626 | $157,778 | $116,868 | $44,595 |
| 2022 | $10,968 | $118,108 | $83,928 | $34,180 |
| 2021 | $10,459 | $121,507 | $86,343 | $35,164 |
| 2020 | $9,360 | $107,536 | $76,505 | $31,031 |
| 2019 | $9,217 | $107,536 | $76,505 | $31,031 |
| 2018 | $8,255 | $95,213 | $61,344 | $33,869 |
| 2017 | $7,997 | $105,263 | $67,819 | $37,444 |
| 2016 | $7,864 | $90,840 | $51,024 | $39,816 |
| 2015 | $7,446 | $74,004 | $32,158 | $41,846 |
| 2014 | $6,222 | $74,004 | $32,158 | $41,846 |
Source: Public Records
Map
Nearby Homes
- 2958 6th St
- 515 Alpine Ave
- 3015 3rd St
- 2675 Dakota Place Unit Newlands
- 3033 3rd St
- 501 Evergreen Ave
- 815 Alpine Ave Unit 2
- 3056 8th St
- 3150 5th St
- 534 Dewey Ave
- 653 Dewey Ave
- 3189 5th St
- 300 Forest Ave
- 2449 5th St
- 1009 Portland Place
- 900 Portland Place
- 946 Portland Place
- 1031 Portland Place Unit 4
- 1020 Portland Place
- 3086 11th St
Your Personal Tour Guide
Ask me questions while you tour the home.