Estimated Value: $302,000 - $356,000
4
Beds
3
Baths
2,439
Sq Ft
$131/Sq Ft
Est. Value
About This Home
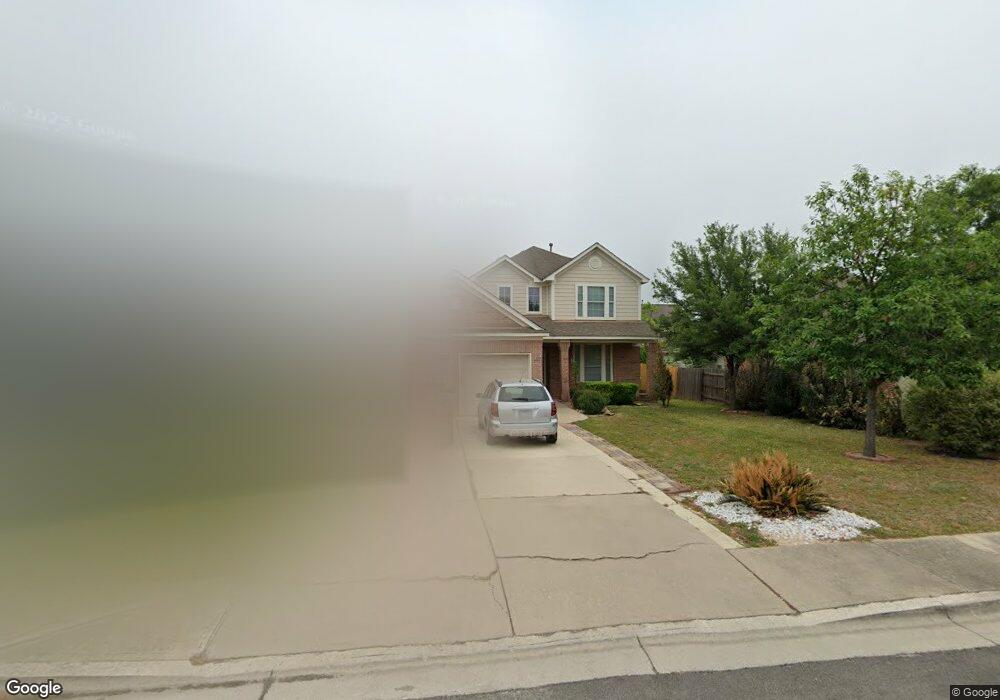
This home is located at 284 Otono Loop, Kyle, TX 78640 and is currently estimated at $320,096, approximately $131 per square foot. 284 Otono Loop is a home located in Hays County with nearby schools including Tobias Elementary School, Laura B Wallace Middle School, and Jack C Hays High School.
Ownership History
Date
Name
Owned For
Owner Type
Purchase Details
Closed on
Jun 17, 2021
Sold by
Enriquez Miguel V and Enriquez Eva M
Bought by
Walters Joshua and Bannon Lisa
Current Estimated Value
Home Financials for this Owner
Home Financials are based on the most recent Mortgage that was taken out on this home.
Original Mortgage
$343,660
Outstanding Balance
$311,141
Interest Rate
2.9%
Mortgage Type
New Conventional
Estimated Equity
$8,955
Purchase Details
Closed on
Oct 26, 2006
Sold by
Perry Homes
Bought by
Enriquez Miguel V and Enriquez Eva M
Home Financials for this Owner
Home Financials are based on the most recent Mortgage that was taken out on this home.
Original Mortgage
$152,150
Interest Rate
6.41%
Mortgage Type
Purchase Money Mortgage
Purchase Details
Closed on
Mar 30, 2005
Sold by
Cdn Farm Ltd
Bought by
Enriquez Miguel V and Enriquez Eva M
Purchase Details
Closed on
May 13, 2003
Sold by
Nash Charles D
Bought by
Enriquez Miguel V and Enriquez Eva M
Create a Home Valuation Report for This Property
The Home Valuation Report is an in-depth analysis detailing your home's value as well as a comparison with similar homes in the area
Home Values in the Area
Average Home Value in this Area
Purchase History
| Date | Buyer | Sale Price | Title Company |
|---|---|---|---|
| Walters Joshua | -- | None Available | |
| Enriquez Miguel V | -- | Gracy Title Company | |
| Enriquez Miguel V | -- | -- | |
| Enriquez Miguel V | -- | -- |
Source: Public Records
Mortgage History
| Date | Status | Borrower | Loan Amount |
|---|---|---|---|
| Open | Walters Joshua | $343,660 | |
| Previous Owner | Enriquez Miguel V | $152,150 |
Source: Public Records
Tax History
| Year | Tax Paid | Tax Assessment Tax Assessment Total Assessment is a certain percentage of the fair market value that is determined by local assessors to be the total taxable value of land and additions on the property. | Land | Improvement |
|---|---|---|---|---|
| 2025 | $7,742 | $337,800 | $70,800 | $267,000 |
| 2024 | $77 | $343,250 | $70,800 | $272,450 |
| 2023 | $8,743 | $391,340 | $88,500 | $302,840 |
| 2022 | $8,886 | $365,090 | $75,000 | $290,090 |
| 2021 | $6,614 | $249,293 | $47,600 | $207,210 |
| 2019 | $6,431 | $232,820 | $28,000 | $204,820 |
| 2018 | $6,095 | $220,070 | $18,450 | $201,620 |
| 2017 | $5,973 | $211,890 | $18,450 | $193,440 |
| 2016 | $5,589 | $198,270 | $18,450 | $179,820 |
| 2015 | $4,459 | $181,320 | $17,850 | $163,470 |
Source: Public Records
Map
Nearby Homes
- 298 Fall Dr
- 229 Ferrule Dr
- 1315 Four Seasons Farm Dr
- 406 Primavera Loop
- 140 Caddis Cove
- 312 Ferrule Dr
- 332 Ferrule Dr
- 394 Verano Dr
- 204 Lehman Rd
- 680 Ferrule Dr
- 676 Ferrule Dr
- 626 Atlantis
- 113 Endeavour
- 901 Whispering Hollow Dr
- 950 Whispering Hollow Dr
- 481 Whispering Hollow Dr
- 203 Endeavour
- 141 Wild Buffalo Dr
- 101 Creekside Villa Dr
- 107 Creekside Villa Dr
Your Personal Tour Guide
Ask me questions while you tour the home.