
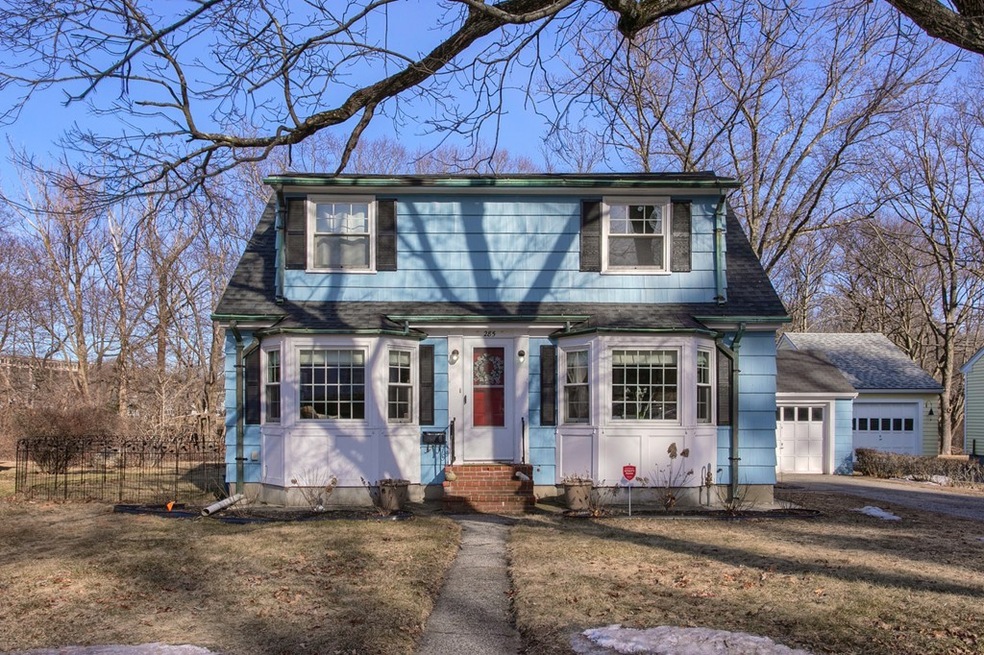
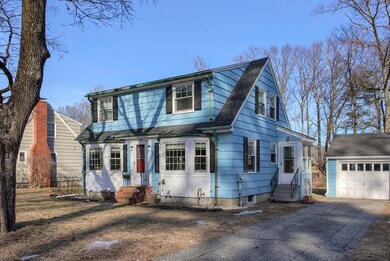


285 N Main St Andover, MA 01810
Shawsheen Heights Neighborhood
3
Beds
2
Baths
1,586
Sq Ft
8,276
Sq Ft Lot
Highlights
- River View
- Wood Flooring
- 3-minute walk to Sacred Heart Reservation
- West Elementary School Rated A-
About This Home
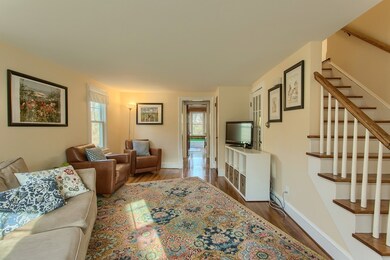
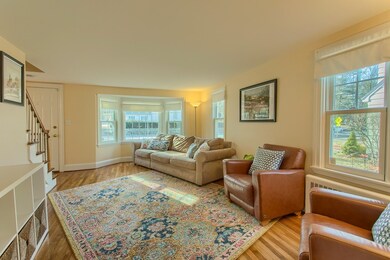
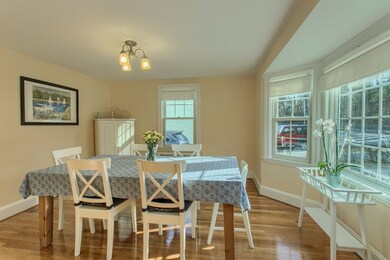
As of May 2024Absolutely nothing to do but move in and enjoy this turn key home! Beautiful views of the Shawsheen River from kitchen and den. Refinished hardwood floors, freshly painted interior & exterior. Bay windows in living & dining rooms bring in lots of natural sunlight. All new windows in den - best room in the house! Centrally located - close to major highways, downtown Andover & schools. Within walking distance of commuter rail. Brand new stainless steal lifetime warranty hot water heater. One car detached garage & lead paint compliance certificate for property.
Home Details
Home Type
- Single Family
Est. Annual Taxes
- $7,942
Year Built
- Built in 1948
Lot Details
- Year Round Access
- Property is zoned SRA
Parking
- 1 Car Garage
Property Views
- River Views
Kitchen
- Range
- Microwave
- Dishwasher
Flooring
- Wood
- Vinyl
Laundry
- Dryer
- Washer
Utilities
- Window Unit Cooling System
- Hot Water Baseboard Heater
- Heating System Uses Oil
- Water Holding Tank
- Oil Water Heater
- Cable TV Available
Additional Features
- Basement
Listing and Financial Details
- Assessor Parcel Number M:00036 B:00100 L:00000
Ownership History
Date
Name
Owned For
Owner Type
Purchase Details
Listed on
Feb 14, 2019
Closed on
May 3, 2019
Sold by
Kalas Edward and Resiak Natalia
Bought by
Emmerth Gregory J
Seller's Agent
Paige Cadogan
Advisors Living - Tewksbury
Buyer's Agent
Daphne Corder
Conway - Swampscott
List Price
$450,000
Sold Price
$430,000
Premium/Discount to List
-$20,000
-4.44%
Total Days on Market
43
Current Estimated Value
Home Financials for this Owner
Home Financials are based on the most recent Mortgage that was taken out on this home.
Estimated Appreciation
$208,390
Avg. Annual Appreciation
6.46%
Original Mortgage
$417,100
Interest Rate
4%
Mortgage Type
New Conventional
Purchase Details
Listed on
Apr 20, 2017
Closed on
Jul 10, 2017
Sold by
Sweeney Anne M Est
Bought by
Kalas Edward and Resiak Natalia
Seller's Agent
Frank Bolway
Stone Wall Real Estate
Buyer's Agent
Paige Cadogan
Advisors Living - Tewksbury
List Price
$429,000
Sold Price
$352,500
Premium/Discount to List
-$76,500
-17.83%
Home Financials for this Owner
Home Financials are based on the most recent Mortgage that was taken out on this home.
Avg. Annual Appreciation
11.47%
Original Mortgage
$282,000
Interest Rate
3.95%
Mortgage Type
New Conventional
Similar Homes in the area
Create a Home Valuation Report for This Property
The Home Valuation Report is an in-depth analysis detailing your home's value as well as a comparison with similar homes in the area
Home Values in the Area
Average Home Value in this Area
Purchase History
| Date | Type | Sale Price | Title Company |
|---|---|---|---|
| Not Resolvable | $430,000 | -- | |
| Not Resolvable | $352,500 | -- |
Source: Public Records
Mortgage History
| Date | Status | Loan Amount | Loan Type |
|---|---|---|---|
| Open | $531,000 | Purchase Money Mortgage | |
| Closed | $531,000 | Purchase Money Mortgage | |
| Closed | $50,000 | Stand Alone Refi Refinance Of Original Loan | |
| Closed | $405,500 | Stand Alone Refi Refinance Of Original Loan | |
| Closed | $423,050 | Stand Alone Refi Refinance Of Original Loan | |
| Closed | $417,100 | New Conventional | |
| Previous Owner | $42,000 | Stand Alone Refi Refinance Of Original Loan | |
| Previous Owner | $282,000 | New Conventional |
Source: Public Records
Property History
| Date | Event | Price | Change | Sq Ft Price |
|---|---|---|---|---|
| 05/31/2024 05/31/24 | Sold | $590,000 | -1.7% | $377 / Sq Ft |
| 04/19/2024 04/19/24 | Pending | -- | -- | -- |
| 04/14/2024 04/14/24 | For Sale | $599,900 | 0.0% | $383 / Sq Ft |
| 04/14/2024 04/14/24 | Off Market | $599,900 | -- | -- |
| 04/11/2024 04/11/24 | Price Changed | $599,900 | -4.0% | $383 / Sq Ft |
| 03/08/2024 03/08/24 | Price Changed | $624,900 | -2.2% | $399 / Sq Ft |
| 02/09/2024 02/09/24 | Price Changed | $639,000 | -1.5% | $408 / Sq Ft |
| 01/24/2024 01/24/24 | For Sale | $649,000 | 0.0% | $414 / Sq Ft |
| 01/21/2024 01/21/24 | Pending | -- | -- | -- |
| 01/09/2024 01/09/24 | For Sale | $649,000 | +50.9% | $414 / Sq Ft |
| 05/10/2019 05/10/19 | Sold | $430,000 | 0.0% | $271 / Sq Ft |
| 03/29/2019 03/29/19 | Pending | -- | -- | -- |
| 02/27/2019 02/27/19 | Price Changed | $430,000 | -4.4% | $271 / Sq Ft |
| 02/14/2019 02/14/19 | For Sale | $450,000 | +27.7% | $284 / Sq Ft |
| 07/10/2017 07/10/17 | Sold | $352,500 | -7.2% | $222 / Sq Ft |
| 05/10/2017 05/10/17 | Pending | -- | -- | -- |
| 05/04/2017 05/04/17 | Price Changed | $379,900 | -5.0% | $240 / Sq Ft |
| 04/26/2017 04/26/17 | Price Changed | $399,900 | -6.8% | $252 / Sq Ft |
| 04/20/2017 04/20/17 | For Sale | $429,000 | -- | $270 / Sq Ft |
Source: MLS Property Information Network (MLS PIN)
Tax History Compared to Growth
Tax History
| Year | Tax Paid | Tax Assessment Tax Assessment Total Assessment is a certain percentage of the fair market value that is determined by local assessors to be the total taxable value of land and additions on the property. | Land | Improvement |
|---|---|---|---|---|
| 2024 | $7,942 | $616,600 | $342,000 | $274,600 |
| 2023 | $7,706 | $564,100 | $316,600 | $247,500 |
| 2022 | $7,173 | $491,300 | $268,200 | $223,100 |
| 2021 | $6,853 | $448,200 | $243,800 | $204,400 |
| 2020 | $6,570 | $437,700 | $237,900 | $199,800 |
| 2019 | $6,497 | $425,500 | $231,000 | $194,500 |
| 2018 | $6,195 | $396,100 | $217,800 | $178,300 |
| 2017 | $5,923 | $390,200 | $213,500 | $176,700 |
| 2016 | $5,783 | $390,200 | $213,500 | $176,700 |
| 2015 | $5,563 | $371,600 | $205,300 | $166,300 |
Source: Public Records
Agents Affiliated with this Home
-
Scot Gabriel
S
Seller's Agent in 2024
Scot Gabriel
Gabriel Realty Group
(508) 633-0712
1 in this area
35 Total Sales
-
Michael Gill
M
Buyer's Agent in 2024
Michael Gill
Eddleston Gill & Company
1 in this area
7 Total Sales
-
Paige Cadogan
Seller's Agent in 2019
Paige Cadogan
Advisors Living - Tewksbury
(617) 784-5768
1 in this area
66 Total Sales
-
Daphne Corder
Buyer's Agent in 2019
Daphne Corder
Conway - Swampscott
(781) 816-3699
32 Total Sales
-
F
Seller's Agent in 2017
Frank Bolway
Stone Wall Real Estate
Map
Source: MLS Property Information Network (MLS PIN)
MLS Number: 72453194
APN: ANDO-000036-000100
Disclaimer: Certain information contained herein is derived from information provided by parties other than Homes.com. All information provided is deemed reliable, but is not guaranteed to be accurate and should be independently verified.
![]() The property listing data and information, or the Images, set forth herein were provided to MLS Property Information Network, Inc. from third party sources, including sellers, lessors and public records, and were compiled by MLS Property Information Network, Inc. The property listing data and information, and the Images, are for the personal, non-commercial use of consumers having a good faith interest in purchasing or leasing listed properties of the type displayed to them and may not be used for any purpose other than to identify prospective properties which such consumers may have a good faith interest in purchasing or leasing. MLS Property Information Network, Inc. and its subscribers disclaim any and all representations and warranties as to the accuracy of the property listing data and information, or as to the accuracy of any of the Images, set forth herein.
The property listing data and information, or the Images, set forth herein were provided to MLS Property Information Network, Inc. from third party sources, including sellers, lessors and public records, and were compiled by MLS Property Information Network, Inc. The property listing data and information, and the Images, are for the personal, non-commercial use of consumers having a good faith interest in purchasing or leasing listed properties of the type displayed to them and may not be used for any purpose other than to identify prospective properties which such consumers may have a good faith interest in purchasing or leasing. MLS Property Information Network, Inc. and its subscribers disclaim any and all representations and warranties as to the accuracy of the property listing data and information, or as to the accuracy of any of the Images, set forth herein.
Nearby Homes
- 1 Carisbrooke St
- 257 N Main St Unit 11
- 60A Washington Park Dr Unit 3
- 30 Washington Park Dr Unit 2
- 4 Fleming Ave
- 30 Riverina Rd
- 2 William St
- 25 Fleming Ave
- 2 Powder Mill Square Unit 2B
- 156 High St
- 9 Hartigan Ct
- 11 Hartigan Ct Unit 11
- 59 William St
- 79 Cheever Cir
- 57 William St
- 2 Longwood Dr Unit 407
- 9 Wescott Rd
- 50 High St Unit 15
- 7 Longwood Dr Unit 212
- 50 Maple Ave