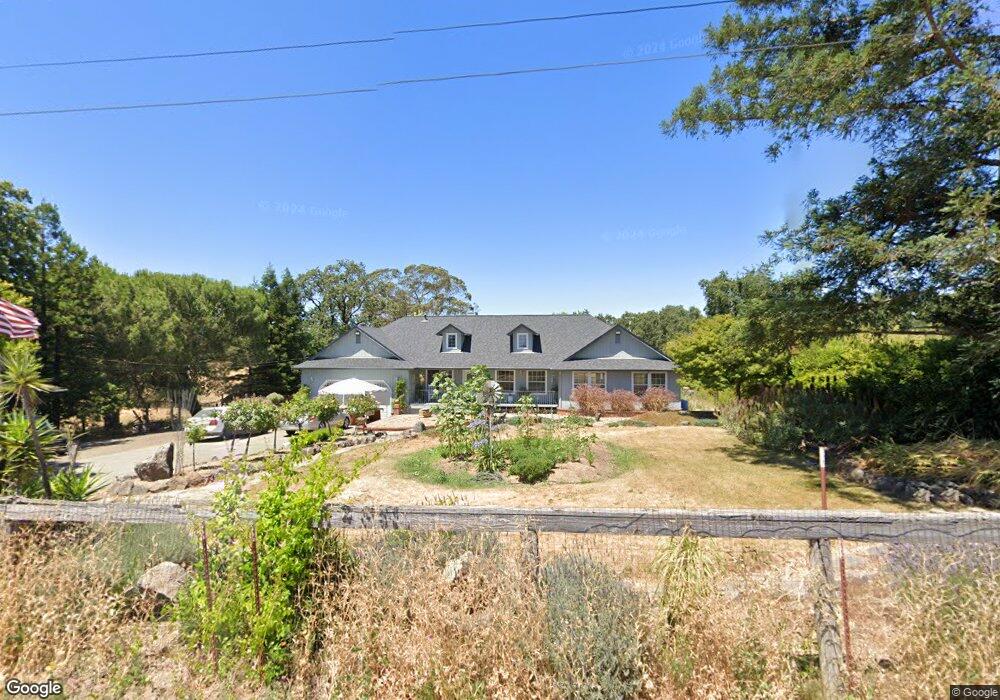
2855 Mark West Station Rd Windsor, CA 95492
Estimated Value: $934,000 - $1,169,000
3
Beds
2
Baths
2,002
Sq Ft
$539/Sq Ft
Est. Value
About This Home
This home is located at 2855 Mark West Station Rd, Windsor, CA 95492 and is currently estimated at $1,079,898, approximately $539 per square foot. 2855 Mark West Station Rd is a home located in Sonoma County with nearby schools including Mattie Washburn Elementary School, Brooks Elementary School, and Windsor Middle School.
Ownership History
Date
Name
Owned For
Owner Type
Purchase Details
Closed on
Feb 27, 2013
Sold by
Messina Joseph Benny and Messina Joseph
Bought by
Messina Joseph Benny and Messina Rosemarie D
Current Estimated Value
Home Financials for this Owner
Home Financials are based on the most recent Mortgage that was taken out on this home.
Original Mortgage
$269,868
Outstanding Balance
$190,180
Interest Rate
3.51%
Mortgage Type
Stand Alone Second
Estimated Equity
$889,718
Purchase Details
Closed on
Dec 24, 1998
Sold by
Lorelei Messina and Lorelei L
Bought by
Messina Joe
Home Financials for this Owner
Home Financials are based on the most recent Mortgage that was taken out on this home.
Original Mortgage
$240,000
Interest Rate
6.82%
Purchase Details
Closed on
Sep 14, 1988
Bought by
Messina Joseph Benny and Messina Rosemarie D
Create a Home Valuation Report for This Property
The Home Valuation Report is an in-depth analysis detailing your home's value as well as a comparison with similar homes in the area
Home Values in the Area
Average Home Value in this Area
Purchase History
| Date | Buyer | Sale Price | Title Company |
|---|---|---|---|
| Messina Joseph Benny | -- | None Available | |
| Messina Joe | -- | First American Title | |
| Messina Joseph Benny | $189,500 | -- |
Source: Public Records
Mortgage History
| Date | Status | Borrower | Loan Amount |
|---|---|---|---|
| Open | Messina Joseph Benny | $269,868 | |
| Closed | Messina Joe | $240,000 |
Source: Public Records
Tax History Compared to Growth
Tax History
| Year | Tax Paid | Tax Assessment Tax Assessment Total Assessment is a certain percentage of the fair market value that is determined by local assessors to be the total taxable value of land and additions on the property. | Land | Improvement |
|---|---|---|---|---|
| 2025 | $4,233 | $351,687 | $129,908 | $221,779 |
| 2024 | $4,233 | $344,792 | $127,361 | $217,431 |
| 2023 | $4,233 | $338,032 | $124,864 | $213,168 |
| 2022 | $4,074 | $331,405 | $122,416 | $208,989 |
| 2021 | $3,988 | $324,908 | $120,016 | $204,892 |
| 2020 | $4,073 | $321,578 | $118,786 | $202,792 |
| 2019 | $4,065 | $315,273 | $116,457 | $198,816 |
| 2018 | $4,005 | $309,092 | $114,174 | $194,918 |
| 2017 | $3,967 | $303,033 | $111,936 | $191,097 |
| 2016 | $3,751 | $297,092 | $109,742 | $187,350 |
| 2015 | $3,649 | $292,630 | $108,094 | $184,536 |
| 2014 | $3,593 | $286,899 | $105,977 | $180,922 |
Source: Public Records
Map
Nearby Homes
- 2711 Mark West Station Rd
- 150 Old Vine Ln
- 9600 Windsor Rd
- 4503 Trenton Rd
- 8668 Starr Rd
- 463 Goblet Place
- 7225 16th Hole Dr
- 432 Goblet Place
- 4020 Woolsey Rd
- 3000 River Rd
- 2705 River Rd
- 7351 15th Hole Dr
- 651 Decanter Cir
- 1349 Golf Course Dr
- 2487 Olivet Rd
- 8453 Trione Cir
- 1101 Rochioli Dr
- 60 Shiloh Rd
- 8009 Cliffrose St
- 8034 Cliffrose St
- 2837 Mark West Station Rd
- 2858 Mark West Station Rd
- 2789 Mark West Station Rd
- 2783 Mark West Station Rd
- 2847 Mark West Station Rd
- 2743 Mark West Station Rd
- 2721 Mark West Station Rd
- 2767 Mark West Station Rd
- 2717 Mark West Station Rd
- 2687 Mark West Station Rd
- 2681 Mark West Station Rd
- 2673 Mark West Station Rd
- 2669 Mark West Station Rd
- 2776 Silk Rd
- 2643 Mark West Station Rd
- 2796 Silk Rd
- 2804 Silk Rd
- 2750 Silk Rd
- 2690 Silk Rd
- 2589 Mark West Station Rd