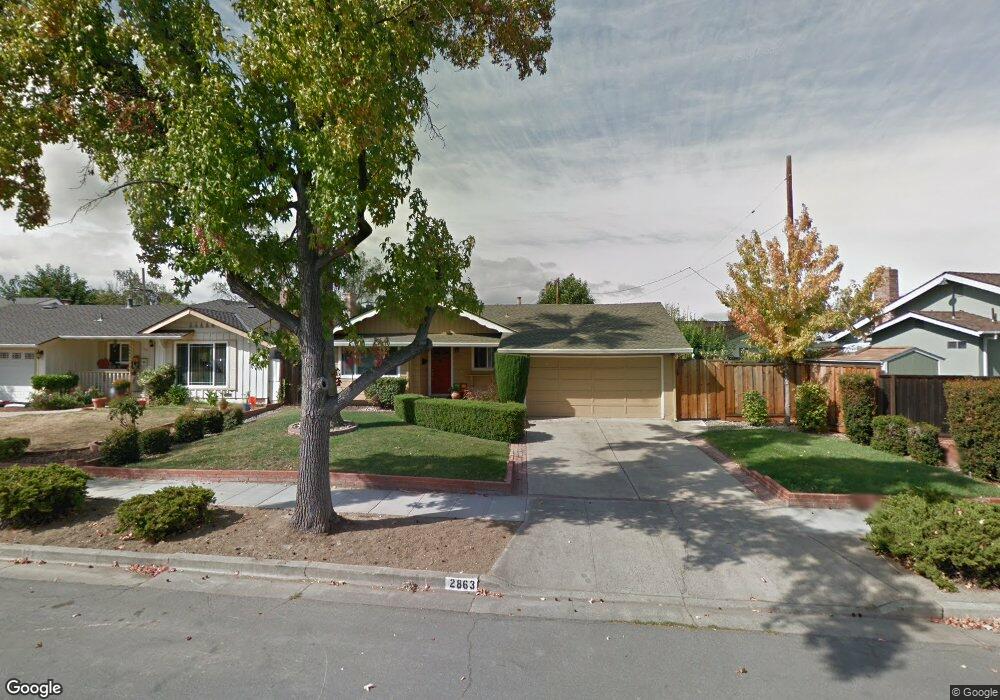
2863 Rustic Dr San Jose, CA 95124
Cambrian NeighborhoodEstimated Value: $1,628,000 - $1,975,111
4
Beds
2
Baths
1,559
Sq Ft
$1,192/Sq Ft
Est. Value
About This Home
This home is located at 2863 Rustic Dr, San Jose, CA 95124 and is currently estimated at $1,858,778, approximately $1,192 per square foot. 2863 Rustic Dr is a home located in Santa Clara County with nearby schools including Branham High School, Fammatre Elementary School, and Sartorette Charter School.
Ownership History
Date
Name
Owned For
Owner Type
Purchase Details
Closed on
May 4, 2009
Sold by
Dimitrov Dimitre P
Bought by
Dimitrov Dimitre and Nikolova Irena R
Current Estimated Value
Home Financials for this Owner
Home Financials are based on the most recent Mortgage that was taken out on this home.
Original Mortgage
$168,000
Interest Rate
4.8%
Mortgage Type
New Conventional
Purchase Details
Closed on
Jan 25, 2002
Sold by
Petrov Peter and Petrova Donka
Bought by
Dimitrov Dimitre P
Home Financials for this Owner
Home Financials are based on the most recent Mortgage that was taken out on this home.
Original Mortgage
$299,396
Outstanding Balance
$115,542
Interest Rate
6.12%
Estimated Equity
$1,743,236
Purchase Details
Closed on
Sep 2, 1999
Sold by
Reece Robert R
Bought by
Petrov Peter and Petrov Donka
Home Financials for this Owner
Home Financials are based on the most recent Mortgage that was taken out on this home.
Original Mortgage
$280,000
Interest Rate
2.95%
Purchase Details
Closed on
Dec 16, 1993
Sold by
Reece Colleen D
Bought by
Reece Robert R
Create a Home Valuation Report for This Property
The Home Valuation Report is an in-depth analysis detailing your home's value as well as a comparison with similar homes in the area
Home Values in the Area
Average Home Value in this Area
Purchase History
| Date | Buyer | Sale Price | Title Company |
|---|---|---|---|
| Dimitrov Dimitre | -- | Old Republic Title Company | |
| Dimitrov Dimitre P | -- | Stewart Title | |
| Petrov Peter | -- | Financial Title Company | |
| Reece Robert R | -- | -- |
Source: Public Records
Mortgage History
| Date | Status | Borrower | Loan Amount |
|---|---|---|---|
| Closed | Dimitrov Dimitre | $168,000 | |
| Open | Dimitrov Dimitre P | $299,396 | |
| Closed | Petrov Peter | $280,000 |
Source: Public Records
Tax History
| Year | Tax Paid | Tax Assessment Tax Assessment Total Assessment is a certain percentage of the fair market value that is determined by local assessors to be the total taxable value of land and additions on the property. | Land | Improvement |
|---|---|---|---|---|
| 2025 | $8,020 | $537,918 | $268,959 | $268,959 |
| 2024 | $8,020 | $527,372 | $263,686 | $263,686 |
| 2023 | $7,932 | $517,032 | $258,516 | $258,516 |
| 2022 | $7,795 | $506,896 | $253,448 | $253,448 |
| 2021 | $7,608 | $496,958 | $248,479 | $248,479 |
| 2020 | $7,255 | $491,864 | $245,932 | $245,932 |
| 2019 | $7,148 | $482,220 | $241,110 | $241,110 |
| 2018 | $6,950 | $472,766 | $236,383 | $236,383 |
| 2017 | $6,781 | $463,498 | $231,749 | $231,749 |
| 2016 | $6,459 | $454,410 | $227,205 | $227,205 |
| 2015 | $6,376 | $447,586 | $223,793 | $223,793 |
| 2014 | $5,867 | $438,820 | $219,410 | $219,410 |
Source: Public Records
Map
Nearby Homes
- 2915 Ross Ave
- 3202 Kimber Ct Unit 49
- 2788 Lexford Ave
- 3137 Hilary Dr
- 3226 Kimber Ct Unit 104
- 3254 Kimber Ct Unit 115
- 2994 Casa Nueva Ct
- 1795 Foxworthy Ave
- 2823 Quinto Way
- 3393 Kathleen St
- 1779 Foxworthy Ave
- 1980 Foxworthy Ave
- 3356 Browning Ave
- 1979 Josephine Ave
- 1775 Wema Way
- 2872 Manda Dr
- 3076 Union Ave
- 3210 Rama Dr
- 1792 Potrero Dr
- 1800 Donna Ln
- 2867 Rustic Dr
- 1880 Orange Grove Dr
- 1878 Orange Grove Dr
- 2871 Rustic Dr
- 1882 Orange Grove Dr
- 2876 Newark Way
- 2892 Newark Way
- 1884 Orange Grove Dr
- 2864 Rustic Dr
- 2875 Rustic Dr
- 2860 Rustic Dr
- 1870 Orange Grove Dr
- 2868 Rustic Dr
- 2910 Newark Way
- 2874 Rustic Dr
- 1879 Orange Grove Dr
- 1881 Orange Grove Dr
- 2881 Rustic Dr
- 1875 Orange Grove Dr
- 2924 Newark Way
Your Personal Tour Guide
Ask me questions while you tour the home.