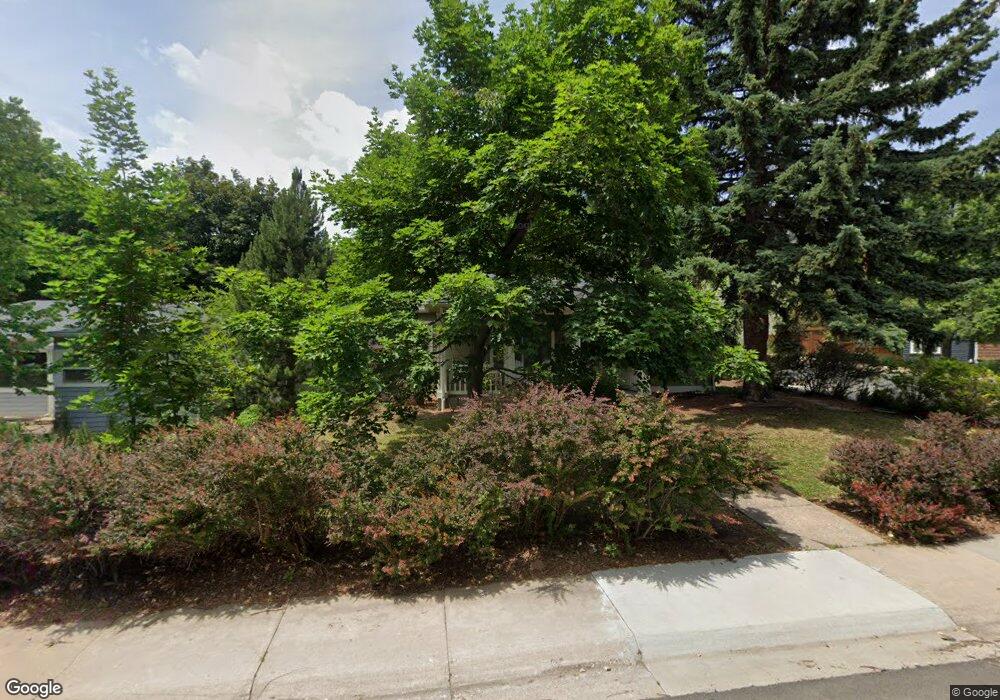
2875 7th St Boulder, CO 80304
Newlands NeighborhoodEstimated Value: $1,829,557 - $2,200,000
3
Beds
2
Baths
1,687
Sq Ft
$1,219/Sq Ft
Est. Value
About This Home
This home is located at 2875 7th St, Boulder, CO 80304 and is currently estimated at $2,056,889, approximately $1,219 per square foot. 2875 7th St is a home located in Boulder County with nearby schools including Foothill Elementary School, Casey Middle School, and Boulder High School.
Ownership History
Date
Name
Owned For
Owner Type
Purchase Details
Closed on
May 18, 2004
Sold by
Zrubek Annie M and Zrybek Kurt A
Bought by
Jaeckle Ned
Current Estimated Value
Purchase Details
Closed on
Jul 8, 2002
Sold by
Spiro Suzanne
Bought by
Zrubek Annie M
Home Financials for this Owner
Home Financials are based on the most recent Mortgage that was taken out on this home.
Original Mortgage
$361,494
Interest Rate
5.52%
Purchase Details
Closed on
Apr 29, 2002
Sold by
Fry E Lucille
Bought by
Spiro Suzanne
Home Financials for this Owner
Home Financials are based on the most recent Mortgage that was taken out on this home.
Original Mortgage
$319,900
Interest Rate
7.25%
Purchase Details
Closed on
May 7, 1954
Bought by
Ned Jaeckle and Schulte Sarah
Create a Home Valuation Report for This Property
The Home Valuation Report is an in-depth analysis detailing your home's value as well as a comparison with similar homes in the area
Home Values in the Area
Average Home Value in this Area
Purchase History
| Date | Buyer | Sale Price | Title Company |
|---|---|---|---|
| Jaeckle Ned | $720,000 | Land Title Guarantee Company | |
| Zrubek Annie M | $451,868 | Security Title | |
| Spiro Suzanne | $399,900 | -- | |
| Ned Jaeckle | $165,000 | -- |
Source: Public Records
Mortgage History
| Date | Status | Borrower | Loan Amount |
|---|---|---|---|
| Previous Owner | Zrubek Annie M | $361,494 | |
| Previous Owner | Spiro Suzanne | $319,900 |
Source: Public Records
Tax History
| Year | Tax Paid | Tax Assessment Tax Assessment Total Assessment is a certain percentage of the fair market value that is determined by local assessors to be the total taxable value of land and additions on the property. | Land | Improvement |
|---|---|---|---|---|
| 2025 | $11,344 | $123,232 | $88,519 | $34,713 |
| 2024 | $11,344 | $123,232 | $88,519 | $34,713 |
| 2023 | $11,726 | $135,782 | $98,101 | $41,366 |
| 2022 | $9,447 | $101,727 | $70,452 | $31,275 |
| 2021 | $9,008 | $104,655 | $72,480 | $32,175 |
| 2020 | $8,001 | $91,920 | $64,207 | $27,713 |
| 2019 | $7,879 | $91,920 | $64,207 | $27,713 |
| 2018 | $6,933 | $79,963 | $51,480 | $28,483 |
| 2017 | $6,716 | $88,404 | $56,914 | $31,490 |
| 2016 | $6,858 | $79,226 | $42,745 | $36,481 |
| 2015 | $6,494 | $66,275 | $35,979 | $30,296 |
| 2014 | $5,572 | $66,275 | $35,979 | $30,296 |
Source: Public Records
Map
Nearby Homes
- 2958 6th St
- 515 Alpine Ave
- 815 Alpine Ave Unit 2
- 3056 8th St
- 501 Evergreen Ave
- 653 Dewey Ave
- 3015 3rd St
- 2675 Dakota Place Unit Newlands
- 3033 3rd St
- 3150 5th St
- 534 Dewey Ave
- 1009 Portland Place
- 3086 11th St
- 3189 5th St
- 1201 Balsam Ave Unit 206
- 900 Portland Place
- 3135 11th St
- 1031 Portland Place Unit 4
- 946 Portland Place
- 1020 Portland Place
Your Personal Tour Guide
Ask me questions while you tour the home.