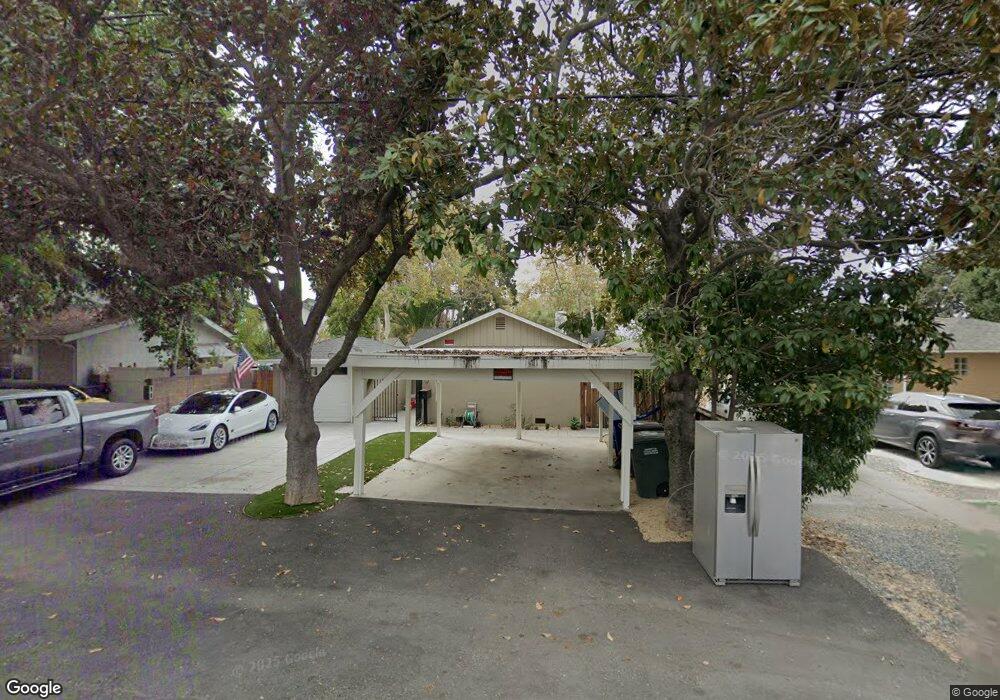
2878 Euclid Ave Concord, CA 94519
Parkside NeighborhoodEstimated Value: $666,000 - $803,000
4
Beds
3
Baths
1,687
Sq Ft
$436/Sq Ft
Est. Value
About This Home
This home is located at 2878 Euclid Ave, Concord, CA 94519 and is currently estimated at $735,177, approximately $435 per square foot. 2878 Euclid Ave is a home located in Contra Costa County with nearby schools including Wren Avenue Elementary School, El Dorado Middle School, and Mt. Diablo High School.
Ownership History
Date
Name
Owned For
Owner Type
Purchase Details
Closed on
Dec 23, 2025
Sold by
Halick Matthew and Halick Shiema C
Bought by
Matthew And Shiema Halick Trust and Halick
Current Estimated Value
Purchase Details
Closed on
Jun 1, 2020
Sold by
My Nu Realty
Bought by
Halick Matthew and Halick Shiema C
Home Financials for this Owner
Home Financials are based on the most recent Mortgage that was taken out on this home.
Original Mortgage
$662,774
Interest Rate
3.2%
Mortgage Type
New Conventional
Purchase Details
Closed on
Mar 28, 2012
Sold by
Fuery John
Bought by
My Nu Realty
Purchase Details
Closed on
Nov 27, 2002
Sold by
Wilson David E
Bought by
Fuery John
Home Financials for this Owner
Home Financials are based on the most recent Mortgage that was taken out on this home.
Original Mortgage
$258,750
Interest Rate
6.28%
Mortgage Type
Stand Alone First
Purchase Details
Closed on
Oct 19, 1998
Sold by
George Mogyorossy and Mogyorossy Gilbert G
Bought by
Wilson David E
Home Financials for this Owner
Home Financials are based on the most recent Mortgage that was taken out on this home.
Original Mortgage
$137,500
Interest Rate
6.71%
Mortgage Type
Purchase Money Mortgage
Create a Home Valuation Report for This Property
The Home Valuation Report is an in-depth analysis detailing your home's value as well as a comparison with similar homes in the area
Home Values in the Area
Average Home Value in this Area
Purchase History
| Date | Buyer | Sale Price | Title Company |
|---|---|---|---|
| Matthew And Shiema Halick Trust | -- | None Listed On Document | |
| Halick Matthew | $675,000 | Wfg National Title Ins Co | |
| My Nu Realty | $173,227 | None Available | |
| Fuery John | $345,000 | Chicago Title | |
| Wilson David E | $175,000 | North American Title Co |
Source: Public Records
Mortgage History
| Date | Status | Borrower | Loan Amount |
|---|---|---|---|
| Previous Owner | Halick Matthew | $662,774 | |
| Previous Owner | Fuery John | $258,750 | |
| Previous Owner | Wilson David E | $137,500 |
Source: Public Records
Tax History
| Year | Tax Paid | Tax Assessment Tax Assessment Total Assessment is a certain percentage of the fair market value that is determined by local assessors to be the total taxable value of land and additions on the property. | Land | Improvement |
|---|---|---|---|---|
| 2025 | $10,012 | $738,207 | $437,456 | $300,751 |
| 2024 | $9,526 | $723,733 | $428,879 | $294,854 |
| 2023 | $9,526 | $709,543 | $420,470 | $289,073 |
| 2022 | $9,372 | $695,631 | $412,226 | $283,405 |
| 2021 | $9,119 | $681,993 | $404,144 | $277,849 |
| 2019 | $4,239 | $246,469 | $168,894 | $77,575 |
| 2018 | $4,050 | $241,637 | $165,583 | $76,054 |
| 2017 | $3,880 | $236,900 | $162,337 | $74,563 |
| 2016 | $3,724 | $232,255 | $159,154 | $73,101 |
| 2015 | $3,451 | $213,993 | $156,764 | $57,229 |
| 2014 | $3,215 | $199,802 | $153,694 | $46,108 |
Source: Public Records
Map
Nearby Homes
- 1861 Parkside Dr
- 1848 Parkside Dr
- 2850 Concord Blvd
- 2601 Sinclair Ave Unit 6
- 2947 Concord Blvd
- 2640 Wisteria Way
- 2837 Bonifacio St
- 3195 Willow Pass Rd
- 1954 N 6th St
- 3162 Salvio St
- 3336 Euclid Ave
- 1385 Galindo St
- 1715 Copperleaf Ct
- 1328 Mesa St
- 2093 Mount Diablo St
- 2108 Roskelley Dr
- 3124 Mount Diablo St
- 2109 N 6th St
- 2105 Holbrook Dr
- 1975 Bonifacio St Unit 5
- 2876 Euclid Ave
- 1845 Parkside Dr
- 2884 Euclid Ave Unit A
- 1847 Parkside Dr
- 2874 Euclid Ave
- 2893 Euclid Ave
- 2895 Euclid Ave
- 2885 Concord Blvd
- 2834 Euclid Ave
- 2869 Concord Blvd
- 2897 Euclid Ave
- 2830 Euclid Ave
- 2851 Fitzgerald Ct
- 2861 Fitzgerald Ct
- 2875 Euclid Ave Unit B
- 2875 Euclid Ave
- 2871 Fitzgerald Ct
- 1857 Parkside Dr
- 1832 Parkside Dr
- 1838 Parkside Dr
Your Personal Tour Guide
Ask me questions while you tour the home.