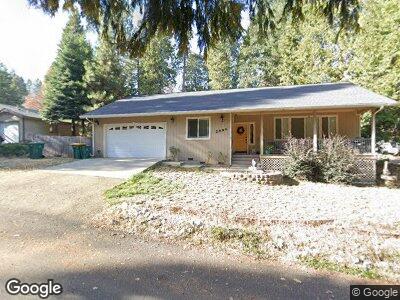
2880 Fir Dr Pollock Pines, CA 95726
Estimated Value: $358,719 - $399,000
3
Beds
2
Baths
1,607
Sq Ft
$240/Sq Ft
Est. Value
About This Home
This home is located at 2880 Fir Dr, Pollock Pines, CA 95726 and is currently estimated at $385,430, approximately $239 per square foot. 2880 Fir Dr is a home located in El Dorado County with nearby schools including Pinewood Elementary School, Sierra Ridge Middle School, and El Dorado High School.
Ownership History
Date
Name
Owned For
Owner Type
Purchase Details
Closed on
Dec 29, 2010
Sold by
Blakefield David F
Bought by
Kamian Richard A and Kamian Barbara A
Current Estimated Value
Purchase Details
Closed on
Jul 18, 2006
Sold by
Quijada Amy
Bought by
Blakefield David F
Home Financials for this Owner
Home Financials are based on the most recent Mortgage that was taken out on this home.
Original Mortgage
$210,000
Interest Rate
6.76%
Mortgage Type
Unknown
Purchase Details
Closed on
Dec 28, 2005
Sold by
Quijada Edward
Bought by
Quijada Amy
Home Financials for this Owner
Home Financials are based on the most recent Mortgage that was taken out on this home.
Original Mortgage
$100,000
Interest Rate
6.87%
Mortgage Type
Purchase Money Mortgage
Create a Home Valuation Report for This Property
The Home Valuation Report is an in-depth analysis detailing your home's value as well as a comparison with similar homes in the area
Home Values in the Area
Average Home Value in this Area
Purchase History
| Date | Buyer | Sale Price | Title Company |
|---|---|---|---|
| Kamian Richard A | $155,000 | Placer Title Company | |
| Blakefield David F | -- | Placer Title Company | |
| Quijada Amy | -- | Placer Title Company | |
| Quijada Amy | -- | Placer Title Co | |
| Quijada Amy | $125,000 | Placer Title Co |
Source: Public Records
Mortgage History
| Date | Status | Borrower | Loan Amount |
|---|---|---|---|
| Previous Owner | Blakefield David F | $336,000 | |
| Previous Owner | Blakefield David F | $41,950 | |
| Previous Owner | Blakefield David F | $210,000 | |
| Previous Owner | Quijada Amy | $100,000 |
Source: Public Records
Tax History Compared to Growth
Tax History
| Year | Tax Paid | Tax Assessment Tax Assessment Total Assessment is a certain percentage of the fair market value that is determined by local assessors to be the total taxable value of land and additions on the property. | Land | Improvement |
|---|---|---|---|---|
| 2024 | $2,139 | $194,672 | $38,930 | $155,742 |
| 2023 | $2,099 | $190,856 | $38,167 | $152,689 |
| 2022 | $2,067 | $187,115 | $37,419 | $149,696 |
| 2021 | $2,046 | $183,447 | $36,686 | $146,761 |
| 2020 | $2,018 | $181,567 | $36,310 | $145,257 |
| 2019 | $1,988 | $178,008 | $35,599 | $142,409 |
| 2018 | $1,923 | $174,518 | $34,901 | $139,617 |
| 2017 | $1,867 | $171,097 | $34,217 | $136,880 |
| 2016 | $1,839 | $167,744 | $33,547 | $134,197 |
| 2015 | $1,798 | $165,226 | $33,044 | $132,182 |
| 2014 | $1,798 | $161,992 | $32,398 | $129,594 |
Source: Public Records
Map
Nearby Homes
- 2845 Pine Ct
- 2880 Polaris St
- 6421 Pony Express Trail Unit 20
- 23 Hub St
- 11 Wheel St
- 12 Rim St
- 2933 Forebay Rd Unit 6
- 2933 Forebay Rd Unit 10
- 2933 Forebay Rd
- 2933 Forebay Rd Unit 25
- 2933 Forebay Rd Unit 18
- 2933 Forebay Rd Unit 28
- 2933 Forebay Rd Unit 17
- 3063 Easy St
- 3175 Easy St
- 2834 Maple Ave
- 6261 Ridgeway Dr
- 6165 Pony Express Trail
- 6165 Pony Express Trail Unit 32
- 6021 Pony Express Trail