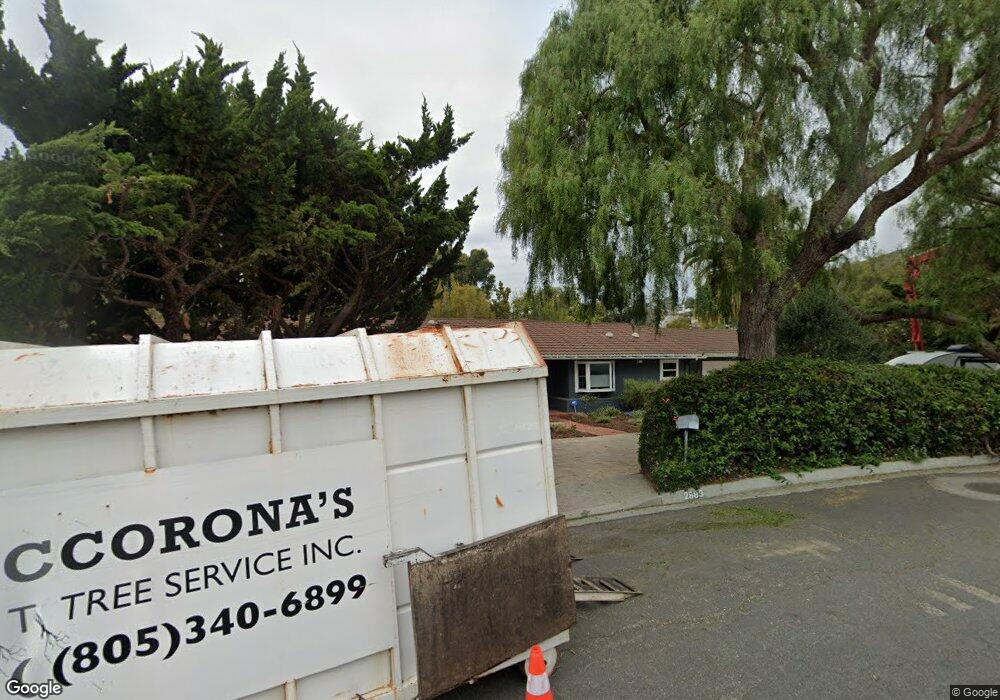
2883 Grove St Ventura, CA 93003
Midtown NeighborhoodEstimated Value: $1,594,000 - $1,947,000
3
Beds
3
Baths
2,714
Sq Ft
$645/Sq Ft
Est. Value
About This Home
This home is located at 2883 Grove St, Ventura, CA 93003 and is currently estimated at $1,749,633, approximately $644 per square foot. 2883 Grove St is a home located in Ventura County with nearby schools including Loma Vista Elementary School, Cabrillo Middle School, and Ventura High School.
Ownership History
Date
Name
Owned For
Owner Type
Purchase Details
Closed on
Oct 15, 2013
Sold by
Haffner Matthew and Haffner Mary
Bought by
Haffner Matthew M and Haffner Mary Ann Milner
Current Estimated Value
Purchase Details
Closed on
Jul 22, 1999
Sold by
Roberg Scot L Maytum Carol L
Bought by
Haffner Matthew and Haffner Mary
Home Financials for this Owner
Home Financials are based on the most recent Mortgage that was taken out on this home.
Original Mortgage
$409,600
Outstanding Balance
$113,011
Interest Rate
7.37%
Estimated Equity
$1,636,622
Purchase Details
Closed on
Jun 7, 1994
Sold by
Schmela Dora E
Bought by
Roberg Scot L and Maytum Carol L
Home Financials for this Owner
Home Financials are based on the most recent Mortgage that was taken out on this home.
Original Mortgage
$315,000
Interest Rate
8.25%
Create a Home Valuation Report for This Property
The Home Valuation Report is an in-depth analysis detailing your home's value as well as a comparison with similar homes in the area
Home Values in the Area
Average Home Value in this Area
Purchase History
| Date | Buyer | Sale Price | Title Company |
|---|---|---|---|
| Haffner Matthew M | -- | Ferguson Case Orr Paterson L | |
| Haffner Matthew | $512,000 | Old Republic Title Company | |
| Roberg Scot L | $350,000 | First American Title Ins Co |
Source: Public Records
Mortgage History
| Date | Status | Borrower | Loan Amount |
|---|---|---|---|
| Open | Haffner Matthew | $409,600 | |
| Previous Owner | Roberg Scot L | $315,000 |
Source: Public Records
Tax History Compared to Growth
Tax History
| Year | Tax Paid | Tax Assessment Tax Assessment Total Assessment is a certain percentage of the fair market value that is determined by local assessors to be the total taxable value of land and additions on the property. | Land | Improvement |
|---|---|---|---|---|
| 2025 | $6,076 | $564,358 | $322,752 | $241,606 |
| 2024 | $6,076 | $553,293 | $316,424 | $236,869 |
| 2023 | $6,002 | $542,445 | $310,220 | $232,225 |
| 2022 | $5,590 | $531,809 | $304,137 | $227,672 |
| 2021 | $5,482 | $521,382 | $298,174 | $223,208 |
| 2020 | $5,429 | $516,037 | $295,117 | $220,920 |
| 2019 | $5,328 | $505,920 | $289,331 | $216,589 |
| 2018 | $5,306 | $502,474 | $283,658 | $218,816 |
| 2017 | $5,194 | $492,623 | $278,097 | $214,526 |
| 2016 | $5,092 | $482,965 | $272,645 | $210,320 |
| 2015 | $5,037 | $475,712 | $268,550 | $207,162 |
| 2014 | $4,953 | $466,396 | $263,291 | $203,105 |
Source: Public Records
Map
Nearby Homes
- 2542 Poli St
- 3124 Grove St
- 505 Briarwood Terrace
- 2407 Sunset Dr
- 2418 Lexington Dr
- 69 S Seaward Ave
- Plan D at Portalvo - Townhomes
- Plan F at Portalvo - Townhomes
- Plan E at Portalvo - Townhomes
- Plan O at Portalvo - Condos/Flats
- Plan A at Portalvo - Townhomes
- Plan H at Portalvo - Condos/Flats
- Plan L at Portalvo - Condos/Flats
- Plan C at Portalvo - Townhomes
- Plan B at Portalvo - Townhomes
- Plan J at Portalvo - Condos/Flats
- Plan G at Portalvo - Townhomes
- Plan N at Portalvo - Condos/Flats
- Plan K at Portalvo - Condos/Flats
- Plan M at Portalvo - Condos/Flats