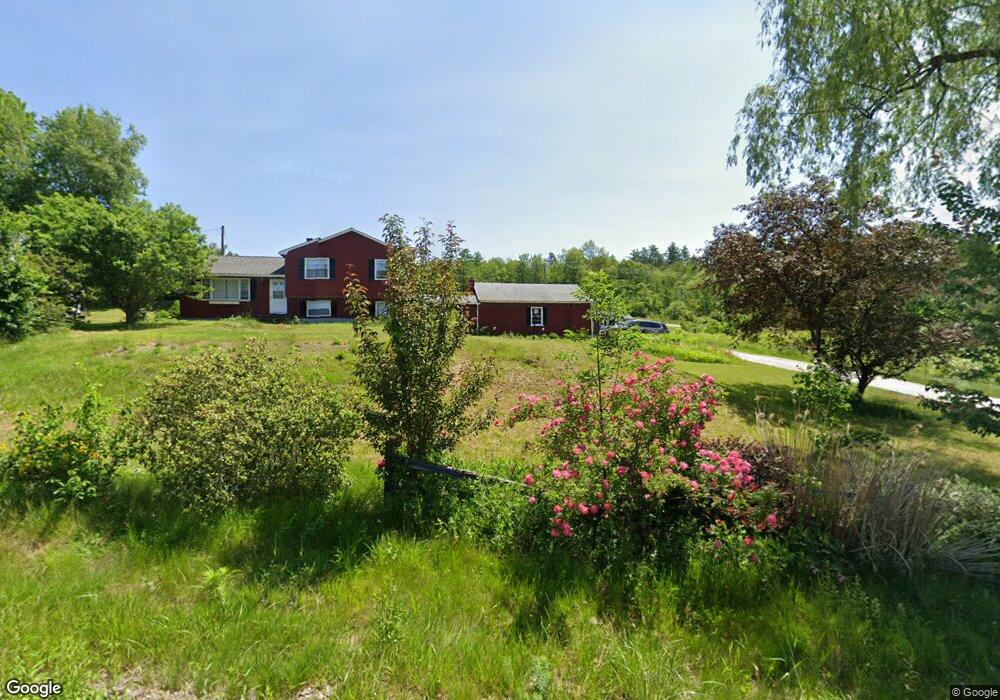
29 Applecrest Ln Andover, NH 03216
Estimated Value: $408,000 - $593,127
3
Beds
3
Baths
2,207
Sq Ft
$225/Sq Ft
Est. Value
About This Home
This home is located at 29 Applecrest Ln, Andover, NH 03216 and is currently estimated at $496,782, approximately $225 per square foot. 29 Applecrest Ln is a home with nearby schools including Andover Elementary Middle School and Merrimack Valley High School.
Ownership History
Date
Name
Owned For
Owner Type
Purchase Details
Closed on
Jul 27, 2020
Sold by
Pilot Realty Llc
Bought by
Frost Jacob P
Current Estimated Value
Home Financials for this Owner
Home Financials are based on the most recent Mortgage that was taken out on this home.
Original Mortgage
$252,090
Outstanding Balance
$224,034
Interest Rate
3.1%
Mortgage Type
New Conventional
Estimated Equity
$272,748
Purchase Details
Closed on
Apr 7, 2020
Sold by
Siemanowicz John E
Bought by
Pilot Realty Llc
Purchase Details
Closed on
Jun 1, 2011
Sold by
John E Siemanowicz Ret
Bought by
Siemanowicz John E
Home Financials for this Owner
Home Financials are based on the most recent Mortgage that was taken out on this home.
Original Mortgage
$103,000
Interest Rate
4.85%
Mortgage Type
Purchase Money Mortgage
Purchase Details
Closed on
Apr 10, 2001
Sold by
Edward W Peterson Est
Bought by
Siemanowicz John E
Home Financials for this Owner
Home Financials are based on the most recent Mortgage that was taken out on this home.
Original Mortgage
$116,000
Interest Rate
7.05%
Mortgage Type
Purchase Money Mortgage
Create a Home Valuation Report for This Property
The Home Valuation Report is an in-depth analysis detailing your home's value as well as a comparison with similar homes in the area
Home Values in the Area
Average Home Value in this Area
Purchase History
| Date | Buyer | Sale Price | Title Company |
|---|---|---|---|
| Frost Jacob P | $130,000 | None Available | |
| Pilot Realty Llc | $100,000 | None Available | |
| Siemanowicz John E | $121,000 | -- | |
| Siemanowicz John E | $145,000 | -- |
Source: Public Records
Mortgage History
| Date | Status | Borrower | Loan Amount |
|---|---|---|---|
| Open | Frost Jacob P | $252,090 | |
| Previous Owner | Siemanowicz John E | $103,000 | |
| Previous Owner | Siemanowicz John E | $116,000 |
Source: Public Records
Tax History Compared to Growth
Tax History
| Year | Tax Paid | Tax Assessment Tax Assessment Total Assessment is a certain percentage of the fair market value that is determined by local assessors to be the total taxable value of land and additions on the property. | Land | Improvement |
|---|---|---|---|---|
| 2024 | $7,535 | $514,700 | $164,900 | $349,800 |
| 2023 | $5,841 | $254,500 | $88,900 | $165,600 |
| 2022 | $4,575 | $215,900 | $88,900 | $127,000 |
| 2021 | $2,377 | $113,700 | $80,100 | $33,600 |
| 2020 | $4,076 | $191,000 | $80,100 | $110,900 |
| 2019 | $4,410 | $203,800 | $80,100 | $123,700 |
| 2018 | $3,994 | $174,100 | $66,200 | $107,900 |
| 2017 | $3,980 | $174,100 | $66,200 | $107,900 |
| 2016 | $3,701 | $174,100 | $66,200 | $107,900 |
| 2015 | $3,461 | $174,100 | $66,200 | $107,900 |
| 2014 | $3,546 | $174,000 | $66,200 | $107,800 |
| 2013 | $3,810 | $203,200 | $91,700 | $111,500 |
Source: Public Records
Map
Nearby Homes
- 32 Maple St
- Lot 02 Franklin Hwy
- 131 Flaghole Rd
- 161 Tucker Mountain Rd
- 0 Putney Rd Unit 433
- 42 Boston Hill Rd
- 32 Monticello Dr
- 2 Monticello Dr
- 428 N Rd
- 428 North Rd
- 215 Lake Shore Dr
- 97 Salisbury Hwy
- 1057 Old Turnpike Rd
- 28 Pine Colony Rd
- 36 Lark St
- 53 Lark St
- 8 Smiling Hill Rd
- 69 Lake Ave
- 151 Beech Hill Rd
- 21 Lake Ave
- 19 Applecrest Ln
- 23 Applecrest Ln
- 11 Applecrest Ln
- 28 Applecrest Ln
- 6 Applecrest Ln
- 7 Applecrest Ln
- 752 Franklin Hwy
- 760 Franklin Hwy
- 50 Chase Hill Rd
- 58 Chase Hill Rd
- 28 Chase Hill Rd
- 706 Franklin Hwy
- 22 Chase Hill Rd
- 37 Channel Rd
- 29 Chase Hill Rd
- 41 Chase Hill Rd
- 702 Franklin Hwy
- 42 Thompson Point Ln
- 110 Channel Rd
- 17 Chase Hill Rd