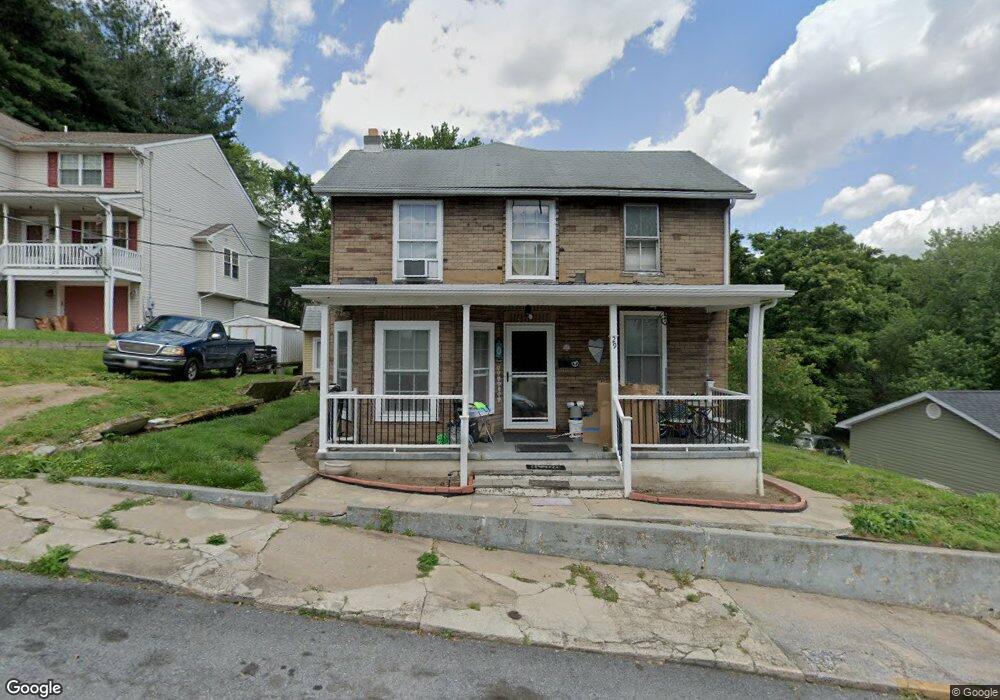
29 E D St Brunswick, MD 21716
Estimated Value: $352,000 - $398,000
5
Beds
2
Baths
2,292
Sq Ft
$162/Sq Ft
Est. Value
About This Home
This home is located at 29 E D St, Brunswick, MD 21716 and is currently estimated at $370,260, approximately $161 per square foot. 29 E D St is a home located in Frederick County with nearby schools including Brunswick Elementary School, Brunswick Middle School, and Brunswick High School.
Ownership History
Date
Name
Owned For
Owner Type
Purchase Details
Closed on
Feb 12, 2009
Sold by
Federal Home Loan Mortgage Corporation
Bought by
Lilly Keith
Current Estimated Value
Purchase Details
Closed on
Aug 22, 2008
Sold by
Zittle Nicholas R and Zittle Cassie M
Bought by
Federal Home Loan Mortgage Corp
Purchase Details
Closed on
Aug 3, 2008
Sold by
Zittle Nicholas R and Zittle Cassie M
Bought by
Federal Home Loan Mortgage Corp
Purchase Details
Closed on
Sep 22, 2003
Sold by
Roudabousch Mary R
Bought by
Zittle Nicholas R and Zittle Cassie M
Create a Home Valuation Report for This Property
The Home Valuation Report is an in-depth analysis detailing your home's value as well as a comparison with similar homes in the area
Home Values in the Area
Average Home Value in this Area
Purchase History
| Date | Buyer | Sale Price | Title Company |
|---|---|---|---|
| Lilly Keith | $110,000 | -- | |
| Federal Home Loan Mortgage Corp | $217,552 | -- | |
| Federal Home Loan Mortgage Corp | $217,552 | -- | |
| Zittle Nicholas R | $128,500 | -- |
Source: Public Records
Mortgage History
| Date | Status | Borrower | Loan Amount |
|---|---|---|---|
| Closed | Lilly Keith | -- |
Source: Public Records
Tax History
| Year | Tax Paid | Tax Assessment Tax Assessment Total Assessment is a certain percentage of the fair market value that is determined by local assessors to be the total taxable value of land and additions on the property. | Land | Improvement |
|---|---|---|---|---|
| 2025 | $3,321 | $254,433 | -- | -- |
| 2024 | $3,321 | $222,200 | $89,200 | $133,000 |
| 2023 | $3,070 | $208,100 | $0 | $0 |
| 2022 | $2,923 | $194,000 | $0 | $0 |
| 2021 | $2,652 | $179,900 | $62,800 | $117,100 |
| 2020 | $2,652 | $169,400 | $0 | $0 |
| 2019 | $2,527 | $158,900 | $0 | $0 |
| 2018 | $2,451 | $148,400 | $45,200 | $103,200 |
| 2017 | $2,420 | $148,400 | $0 | $0 |
| 2016 | $2,643 | $146,267 | $0 | $0 |
| 2015 | $2,643 | $145,200 | $0 | $0 |
| 2014 | $2,643 | $145,200 | $0 | $0 |
Source: Public Records
Map
Nearby Homes
- 37 E C St
- 0 E D St Unit MDFR2057714
- 44 E B St
- 519 N Maple Ave
- 7 W B St
- 102 E A St
- 505 4th Ave
- 15 N Maryland Ave
- 8 S Maple Ave
- 801 N Maple Ave
- 22 N Virginia Ave
- 8 N Virginia Ave
- 0 E Potomac St Unit MDFR2078442
- TBB Shenandoah View Pkwy Unit ORCHID
- 21 W Orndorff Dr
- Homesite 232 Potomac View Pkwy
- 234 Potomac View Pkwy
- 1107 2nd Ave
- 805 E B St
- 9 9th Ave
Your Personal Tour Guide
Ask me questions while you tour the home.