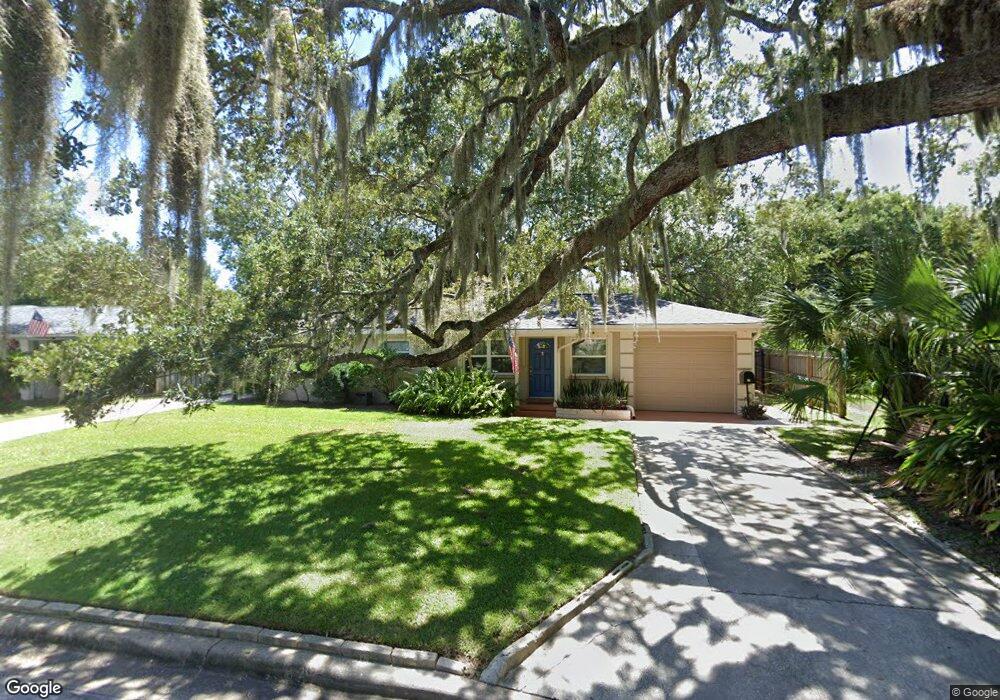
29 Littlejohn Ln Rockledge, FL 32955
Estimated Value: $245,136 - $298,000
2
Beds
2
Baths
1,104
Sq Ft
$256/Sq Ft
Est. Value
About This Home
This home is located at 29 Littlejohn Ln, Rockledge, FL 32955 and is currently estimated at $282,284, approximately $255 per square foot. 29 Littlejohn Ln is a home located in Brevard County with nearby schools including Tropical Elementary School, Ronald McNair Magnet Middle School, and Rockledge Senior High School.
Ownership History
Date
Name
Owned For
Owner Type
Purchase Details
Closed on
May 31, 2017
Sold by
Sinilnikoff Alex
Bought by
Heasley Lynn and Brewster Keith C
Current Estimated Value
Purchase Details
Closed on
Nov 28, 2016
Sold by
Sinilnikoff Alex and Miracle Christina
Bought by
Sinilnikoff Alex
Purchase Details
Closed on
Nov 1, 2016
Bought by
Heasley Lynn
Purchase Details
Closed on
Nov 13, 2014
Sold by
Korey Limited Family Partnership
Bought by
Sinilnikoff Alex and Miracle Christina
Purchase Details
Closed on
Jun 8, 2001
Sold by
Weaver Charlie C and Weaver Virginia E
Bought by
Korey Ltd Family Ptnr
Home Financials for this Owner
Home Financials are based on the most recent Mortgage that was taken out on this home.
Original Mortgage
$114,900
Interest Rate
7.06%
Create a Home Valuation Report for This Property
The Home Valuation Report is an in-depth analysis detailing your home's value as well as a comparison with similar homes in the area
Home Values in the Area
Average Home Value in this Area
Purchase History
| Date | Buyer | Sale Price | Title Company |
|---|---|---|---|
| Heasley Lynn | $155,000 | Fidelity Natl Title Of Flori | |
| Heasley Lynn | $155,000 | Fidelity National Title Of F | |
| Sinilnikoff Alex | -- | None Available | |
| Heasley Lynn | $100 | -- | |
| Sinilnikoff Alex | $100,000 | Attorney | |
| Korey Ltd Family Ptnr | $129,900 | -- |
Source: Public Records
Mortgage History
| Date | Status | Borrower | Loan Amount |
|---|---|---|---|
| Previous Owner | Korey Ltd Family Ptnr | $114,900 |
Source: Public Records
Tax History
| Year | Tax Paid | Tax Assessment Tax Assessment Total Assessment is a certain percentage of the fair market value that is determined by local assessors to be the total taxable value of land and additions on the property. | Land | Improvement |
|---|---|---|---|---|
| 2025 | $3,110 | $198,550 | -- | -- |
| 2024 | $3,042 | $202,420 | -- | -- |
| 2023 | $3,042 | $205,820 | $0 | $0 |
| 2022 | $2,532 | $157,150 | $0 | $0 |
| 2021 | $2,413 | $138,890 | $40,000 | $98,890 |
| 2020 | $2,411 | $136,160 | $37,340 | $98,820 |
| 2019 | $2,410 | $132,840 | $37,340 | $95,500 |
| 2018 | $2,410 | $129,450 | $37,340 | $92,110 |
| 2017 | $1,560 | $80,030 | $28,940 | $51,090 |
| 2016 | $1,520 | $75,200 | $28,940 | $46,260 |
| 2015 | $1,427 | $68,330 | $28,940 | $39,390 |
| 2014 | $1,331 | $63,000 | $28,940 | $34,060 |
Source: Public Records
Map
Nearby Homes
- 213 Sweet St
- 118 Bougainvillea Dr
- 16 South St
- 114 Dudley Dr
- 104 Riverside Dr Unit 203
- 104 Riverside Dr Unit 402
- 104 Riverside Dr Unit 403
- 102 Riverside Dr Unit 203
- 102 Riverside Dr Unit 302
- 607 Rockledge Dr
- 35 Loch Ness Dr
- 29 Riverside Dr Unit 203
- 840 Florida Ave Unit 5
- 21 Riverside Dr Unit 902
- 635 Orange Ct
- 222 Rosa L Jones Dr
- 72 Rockledge Ave
- 130 Valencia Rd
- 433 King St
- 93 Delannoy Ave Unit 601
- 31 Littlejohn Ln
- 30 Freeman Way
- 27 Littlejohn Ln
- 30 Littlejohn Ln
- 32 Littlejohn Ln
- 33 Littlejohn Ln
- 25 Littlejohn Ln
- 34 Littlejohn Ln
- 28 Littlejohn Ln
- 35 Littlejohn Ln
- 23 Littlejohn Ln
- 26 Littlejohn Ln
- 37 Littlejohn Ln
- 24 Littlejohn Ln
- 21 Littlejohn Ln
- 36 Littlejohn Ln
- 39 Littlejohn Ln
- 16 Hardee Cir N
- 22 Littlejohn Ln
- 41 Sweet St
Your Personal Tour Guide
Ask me questions while you tour the home.