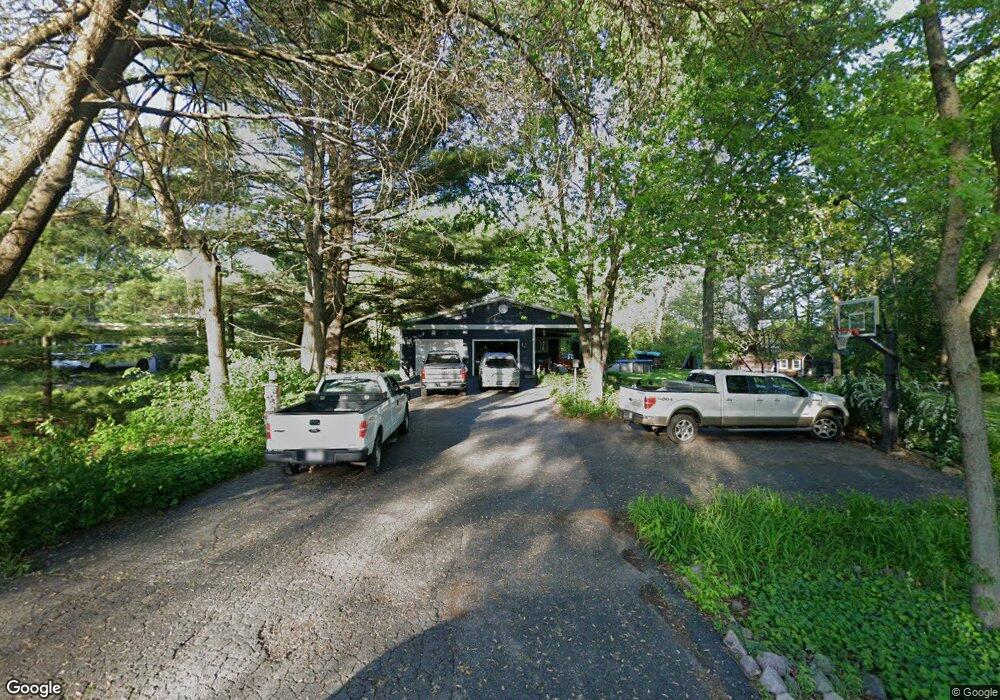
29 Oakhill Dr Oswego, IL 60543
Northwest Oswego NeighborhoodEstimated Value: $451,000 - $517,000
5
Beds
3
Baths
2,200
Sq Ft
$220/Sq Ft
Est. Value
About This Home
This home is located at 29 Oakhill Dr, Oswego, IL 60543 and is currently estimated at $483,738, approximately $219 per square foot. 29 Oakhill Dr is a home located in Kendall County with nearby schools including Hunt Club Elementary School, Traughber Junior High School, and Oswego High School.
Ownership History
Date
Name
Owned For
Owner Type
Purchase Details
Closed on
Mar 17, 2017
Sold by
Right Rail Llc
Bought by
Rempel Graham and Rempel Trisha
Current Estimated Value
Home Financials for this Owner
Home Financials are based on the most recent Mortgage that was taken out on this home.
Original Mortgage
$257,165
Outstanding Balance
$215,182
Interest Rate
4.5%
Mortgage Type
New Conventional
Estimated Equity
$268,556
Purchase Details
Closed on
Nov 20, 2013
Sold by
Farrell Jacobs Catherine M and Katz Catherine M
Bought by
Right Rail Llc Series 29
Purchase Details
Closed on
Nov 8, 1999
Sold by
Jacobs Michael J
Bought by
Jacobs Catherine M and Farrell Jacobs Catherine M
Create a Home Valuation Report for This Property
The Home Valuation Report is an in-depth analysis detailing your home's value as well as a comparison with similar homes in the area
Home Values in the Area
Average Home Value in this Area
Purchase History
| Date | Buyer | Sale Price | Title Company |
|---|---|---|---|
| Rempel Graham | $271,000 | Chicago Title Insurance Comp | |
| Right Rail Llc Series 29 | -- | None Available | |
| Jacobs Catherine M | -- | -- |
Source: Public Records
Mortgage History
| Date | Status | Borrower | Loan Amount |
|---|---|---|---|
| Open | Rempel Graham | $257,165 |
Source: Public Records
Tax History Compared to Growth
Tax History
| Year | Tax Paid | Tax Assessment Tax Assessment Total Assessment is a certain percentage of the fair market value that is determined by local assessors to be the total taxable value of land and additions on the property. | Land | Improvement |
|---|---|---|---|---|
| 2024 | $9,944 | $139,047 | $15,249 | $123,798 |
| 2023 | $8,956 | $124,149 | $13,615 | $110,534 |
| 2022 | $8,956 | $112,709 | $12,360 | $100,349 |
| 2021 | $8,722 | $106,584 | $12,360 | $94,224 |
| 2020 | $8,490 | $102,960 | $12,360 | $90,600 |
| 2019 | $8,336 | $99,961 | $12,000 | $87,961 |
| 2018 | $8,224 | $92,304 | $12,000 | $80,304 |
| 2017 | $8,329 | $86,356 | $12,000 | $74,356 |
| 2016 | $7,406 | $75,310 | $16,908 | $58,402 |
| 2015 | $7,048 | $68,037 | $15,340 | $52,697 |
Source: Public Records
Map
Nearby Homes
- 1 S Orchard Rd
- 537 Arbor Ln
- 114 Riverview Ct
- 0000 Riverwood Dr
- 514 Bentson St
- 5161 US Highway 34
- 411 Bayberry Dr
- 125 Presidential Blvd Unit 3248
- 338 Millstream Ln Unit 1
- LOT 10 SW Station Dr
- 238 Willowwood Dr
- 123 W Benton St
- 5055 U S 34
- 505 Parkland Ct
- 418-420 Monroe St
- 760 Churchill Ln
- Vacant LOT 17 Lyncliff Dr
- 517 Meadowwood Ln Unit 3
- 403 Lake Ct
- 602 Clearwater Ct Unit 2