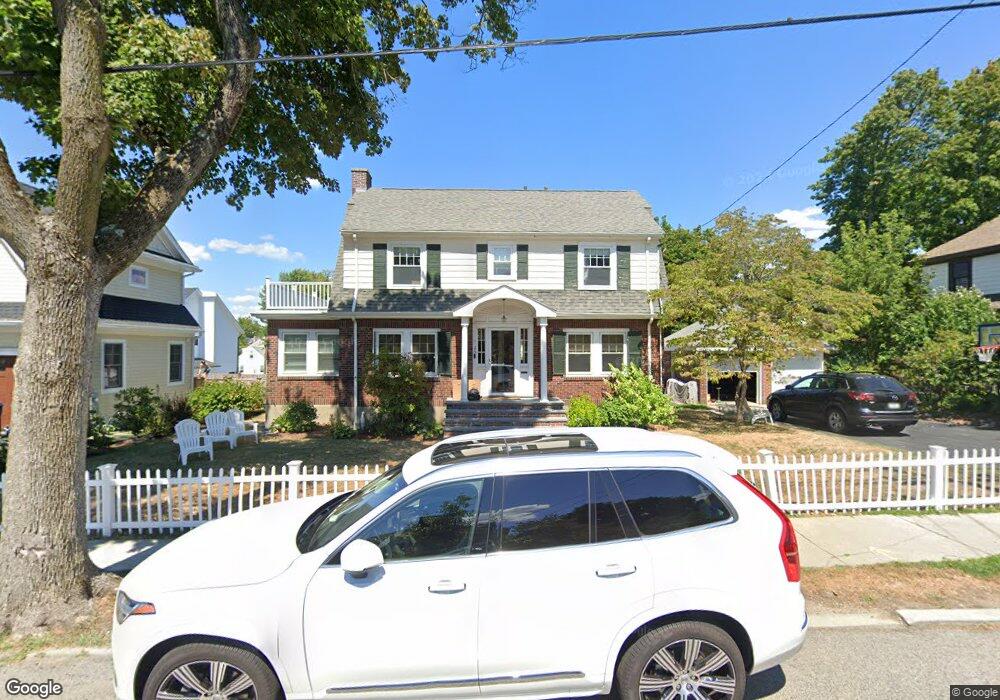
29 Pleasant St Newton, MA 02459
West Newton NeighborhoodEstimated Value: $1,509,000 - $1,833,000
3
Beds
3
Baths
2,209
Sq Ft
$754/Sq Ft
Est. Value
About This Home
This home is located at 29 Pleasant St, Newton, MA 02459 and is currently estimated at $1,666,238, approximately $754 per square foot. 29 Pleasant St is a home located in Middlesex County with nearby schools including Franklin Elementary School, F.A. Day Middle School, and Newton North High School.
Ownership History
Date
Name
Owned For
Owner Type
Purchase Details
Closed on
Feb 14, 2019
Sold by
Tiku Neel K and Shah Roopshree R
Bought by
Roopshree R Shah 2019 Ft and Shah
Current Estimated Value
Purchase Details
Closed on
Aug 18, 2014
Sold by
Xie George G and Du Lina
Bought by
Tiku Neel K and Shah Roopshree
Home Financials for this Owner
Home Financials are based on the most recent Mortgage that was taken out on this home.
Original Mortgage
$736,000
Interest Rate
4%
Mortgage Type
Adjustable Rate Mortgage/ARM
Purchase Details
Closed on
Jun 7, 1994
Sold by
Bonica Anthony and Mcdermott Rosemary B
Bought by
Xie George G and Du Lina
Home Financials for this Owner
Home Financials are based on the most recent Mortgage that was taken out on this home.
Original Mortgage
$210,400
Interest Rate
8.49%
Mortgage Type
Purchase Money Mortgage
Create a Home Valuation Report for This Property
The Home Valuation Report is an in-depth analysis detailing your home's value as well as a comparison with similar homes in the area
Home Values in the Area
Average Home Value in this Area
Purchase History
| Date | Buyer | Sale Price | Title Company |
|---|---|---|---|
| Roopshree R Shah 2019 Ft | -- | -- | |
| Roopshree R Shah 2019 Ft | -- | -- | |
| Tiku Neel K | $930,000 | -- | |
| Xie George G | $263,000 | -- |
Source: Public Records
Mortgage History
| Date | Status | Borrower | Loan Amount |
|---|---|---|---|
| Previous Owner | Tiku Neel K | $736,000 | |
| Previous Owner | Xie George G | $205,000 | |
| Previous Owner | Xie George G | $203,000 | |
| Previous Owner | Xie George G | $210,400 |
Source: Public Records
Tax History Compared to Growth
Tax History
| Year | Tax Paid | Tax Assessment Tax Assessment Total Assessment is a certain percentage of the fair market value that is determined by local assessors to be the total taxable value of land and additions on the property. | Land | Improvement |
|---|---|---|---|---|
| 2025 | $14,850 | $1,515,300 | $890,800 | $624,500 |
| 2024 | $12,642 | $1,295,300 | $864,900 | $430,400 |
| 2023 | $12,121 | $1,190,700 | $664,000 | $526,700 |
| 2022 | $11,598 | $1,102,500 | $614,800 | $487,700 |
| 2021 | $10,873 | $1,010,500 | $580,000 | $430,500 |
| 2020 | $10,444 | $1,000,400 | $580,000 | $420,400 |
| 2019 | $10,150 | $971,300 | $563,100 | $408,200 |
| 2018 | $9,651 | $892,000 | $508,900 | $383,100 |
| 2017 | $9,316 | $837,800 | $480,100 | $357,700 |
| 2016 | $8,911 | $783,000 | $448,700 | $334,300 |
| 2015 | $7,650 | $658,900 | $419,300 | $239,600 |
Source: Public Records
Map
Nearby Homes
- 53-55 N Gate Park
- 41 Kilburn Rd
- 75 Cherry St
- 287 Cherry St Unit 2
- 76 Harding St
- 76 Taft Ave Unit 1
- 76 Taft Ave
- 76 Taft Ave Unit 2
- 44 Westland Ave
- 56 Dearborn St
- 321 Albemarle Rd
- 97 North St
- 106 River St Unit 18
- 106 River St Unit 2
- 106 River St Unit 14
- 371 Cherry St
- 2 Elm St Unit 6
- 2 Elm St Unit 8
- 27 Cross St Unit 27
- 33 Joseph Rd
- 29 Pleasant St
- 21 Pleasant St
- 76 Hatfield Rd
- 37 Pleasant St
- 80 Hatfield Rd
- 49 Lyme Rd
- 34 Pleasant St
- 26 Pleasant St
- 26 Pleasant St
- 70 Hatfield Rd
- 6 Rangeley Rd
- 20 Pleasant St
- 20 Pleasant St
- 11 Pleasant St
- 75 Hatfield Rd
- 45 Pleasant St
- 52 Lyme Rd
- 85 Fuller Terrace
- 85 Fuller Terrace Unit 2
- 64 Hatfield Rd