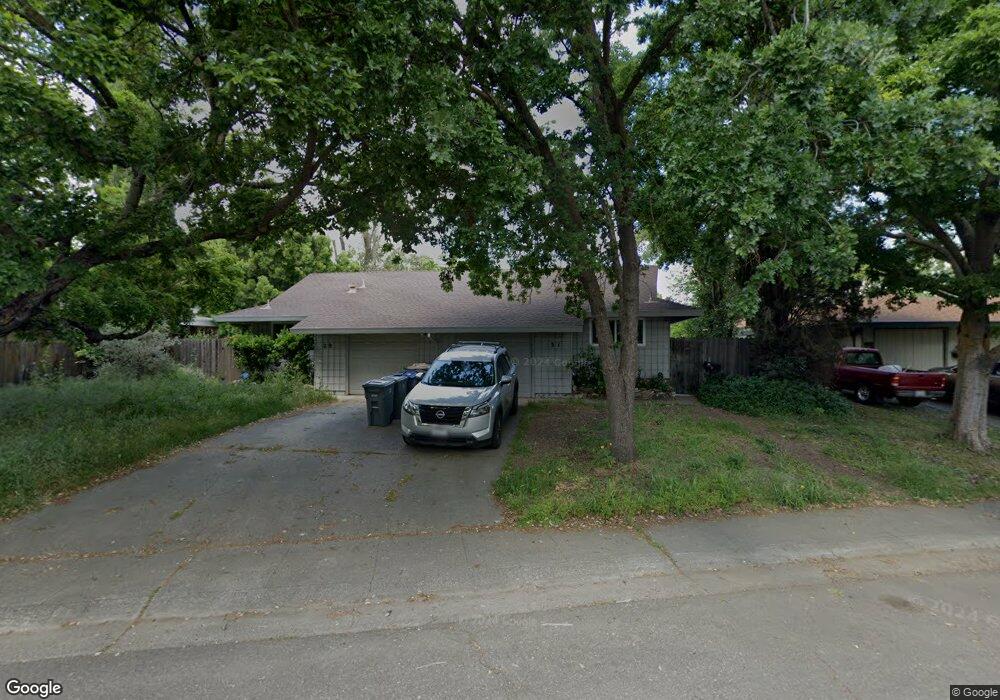
29 Simmons Way Unit 31 Davis, CA 95616
East Davis NeighborhoodEstimated Value: $749,025 - $851,000
4
Beds
2
Baths
1,878
Sq Ft
$430/Sq Ft
Est. Value
About This Home
This home is located at 29 Simmons Way Unit 31, Davis, CA 95616 and is currently estimated at $808,256, approximately $430 per square foot. 29 Simmons Way Unit 31 is a home located in Yolo County with nearby schools including Birch Lane Elementary School, Oliver Wendell Holmes Junior High School, and Davis Senior High School.
Ownership History
Date
Name
Owned For
Owner Type
Purchase Details
Closed on
Feb 23, 2015
Sold by
Dolan Mark J and Dolan Theodora E
Bought by
Mark J Dolan & Theodora E Dolan Family T
Current Estimated Value
Purchase Details
Closed on
Jun 18, 2011
Sold by
Dolan Eric E
Bought by
Dolan Mark J and Dolan Theodora E
Purchase Details
Closed on
May 22, 2003
Sold by
Dolan Eric E and Dolan Mark J
Bought by
Dolan Eric E and Dolan Mark J
Home Financials for this Owner
Home Financials are based on the most recent Mortgage that was taken out on this home.
Original Mortgage
$264,000
Interest Rate
5.71%
Mortgage Type
Purchase Money Mortgage
Purchase Details
Closed on
Nov 14, 2000
Sold by
Mischkot Ramon T & Peggy Tr
Bought by
Dolan Eric E and Dolan Mark J
Home Financials for this Owner
Home Financials are based on the most recent Mortgage that was taken out on this home.
Original Mortgage
$228,800
Interest Rate
7.86%
Create a Home Valuation Report for This Property
The Home Valuation Report is an in-depth analysis detailing your home's value as well as a comparison with similar homes in the area
Home Values in the Area
Average Home Value in this Area
Purchase History
We collect this data history from publicly available records. To have your information removed, we recommend requesting removal directly through your county’s website.
| Date | Buyer | Sale Price | Title Company |
|---|---|---|---|
| Mark J Dolan & Theodora E Dolan Family T | -- | None Available | |
| Dolan Mark J | -- | None Available | |
| Dolan Mark J | $215,000 | None Available | |
| Dolan Eric E | -- | Fidelity National Title | |
| Dolan Eric E | $286,000 | North American Title Guarant |
Source: Public Records
Mortgage History
We collect this data history from publicly available records. To have your information removed, we recommend requesting removal directly through your county’s website.
| Date | Status | Borrower | Loan Amount |
|---|---|---|---|
| Previous Owner | Dolan Eric E | $264,000 | |
| Previous Owner | Dolan Eric E | $228,800 |
Source: Public Records
Tax History
| Year | Tax Paid | Tax Assessment Tax Assessment Total Assessment is a certain percentage of the fair market value that is determined by local assessors to be the total taxable value of land and additions on the property. | Land | Improvement |
|---|---|---|---|---|
| 2025 | $6,422 | $453,318 | $148,597 | $304,721 |
| 2023 | $6,422 | $435,718 | $142,828 | $292,890 |
| 2022 | $6,149 | $427,176 | $140,028 | $287,148 |
| 2021 | $6,000 | $418,801 | $137,283 | $281,518 |
| 2020 | $5,902 | $414,508 | $135,876 | $278,632 |
| 2019 | $5,604 | $406,381 | $133,212 | $273,169 |
| 2018 | $5,231 | $398,413 | $130,600 | $267,813 |
| 2017 | $5,122 | $390,602 | $128,040 | $262,562 |
| 2016 | $4,934 | $382,944 | $125,530 | $257,414 |
| 2015 | $4,847 | $377,193 | $123,645 | $253,548 |
| 2014 | $4,768 | $369,805 | $121,223 | $248,582 |
Source: Public Records
Map
Nearby Homes
- 33 Simmons Way Unit 35
- 25 Simmons Way
- 1504 Tulane Dr
- 1510 Tulane Dr
- 945 Cypress Ln
- 947 Cypress Ln
- 1428 Tulane Dr
- 1518 Tulane Dr
- 21 Simmons Way Unit 23
- 1526 Tulane Dr
- 19 Simmons Way
- 951 Cypress Ln
- 1416 Tulane Dr
- 17 Simmons Way
- 1505 Tulane Dr
- 936 Cypress Ln
- 1427 Tulane Dr
- 1513 Tulane Dr
- 940 Cypress Ln
- 1421 Tulane Dr
Your Personal Tour Guide
Ask me questions while you tour the home.