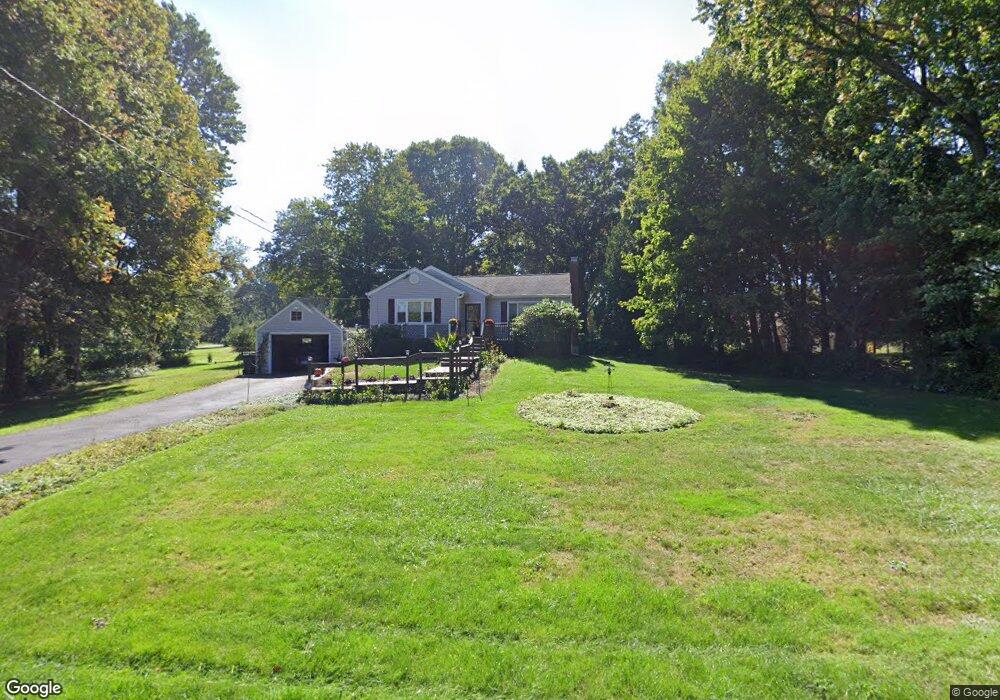
29 Westwood Dr Danbury, CT 06811
Estimated Value: $345,000 - $492,000
2
Beds
1
Bath
985
Sq Ft
$427/Sq Ft
Est. Value
About This Home
This home is located at 29 Westwood Dr, Danbury, CT 06811 and is currently estimated at $420,254, approximately $426 per square foot. 29 Westwood Dr is a home located in Fairfield County with nearby schools including Mill Ridge Primary School, Rogers Park Middle School, and Danbury High School.
Ownership History
Date
Name
Owned For
Owner Type
Purchase Details
Closed on
Jul 1, 2009
Sold by
Litke Ronald and Litke Bonnie
Bought by
Berger Patricia
Current Estimated Value
Home Financials for this Owner
Home Financials are based on the most recent Mortgage that was taken out on this home.
Original Mortgage
$253,255
Interest Rate
4.86%
Purchase Details
Closed on
Sep 27, 2001
Sold by
Stdenis Christina M
Bought by
Litke Bonnie and Litke Ronald
Home Financials for this Owner
Home Financials are based on the most recent Mortgage that was taken out on this home.
Original Mortgage
$132,400
Interest Rate
6.91%
Purchase Details
Closed on
Nov 25, 1997
Sold by
Doud Brian and Doud Kirsten
Bought by
Stdenis Christina
Home Financials for this Owner
Home Financials are based on the most recent Mortgage that was taken out on this home.
Original Mortgage
$125,750
Interest Rate
7.17%
Mortgage Type
Unknown
Purchase Details
Closed on
Sep 18, 1992
Sold by
Bannwart Roberto and Bannwart Claire
Bought by
Doud Brian
Create a Home Valuation Report for This Property
The Home Valuation Report is an in-depth analysis detailing your home's value as well as a comparison with similar homes in the area
Home Values in the Area
Average Home Value in this Area
Purchase History
| Date | Buyer | Sale Price | Title Company |
|---|---|---|---|
| Berger Patricia | $262,000 | -- | |
| Litke Bonnie | $190,500 | -- | |
| Stdenis Christina | $148,000 | -- | |
| Doud Brian | $141,725 | -- |
Source: Public Records
Mortgage History
| Date | Status | Borrower | Loan Amount |
|---|---|---|---|
| Open | Doud Brian | $246,797 | |
| Closed | Doud Brian | $253,255 | |
| Previous Owner | Doud Brian | $132,400 | |
| Previous Owner | Doud Brian | $125,750 |
Source: Public Records
Tax History Compared to Growth
Tax History
| Year | Tax Paid | Tax Assessment Tax Assessment Total Assessment is a certain percentage of the fair market value that is determined by local assessors to be the total taxable value of land and additions on the property. | Land | Improvement |
|---|---|---|---|---|
| 2025 | $5,428 | $217,210 | $93,730 | $123,480 |
| 2024 | $5,309 | $217,210 | $93,730 | $123,480 |
| 2023 | $5,068 | $217,210 | $93,730 | $123,480 |
| 2022 | $4,594 | $162,800 | $90,500 | $72,300 |
| 2021 | $4,493 | $162,800 | $90,500 | $72,300 |
| 2020 | $20,632 | $162,800 | $90,500 | $72,300 |
| 2019 | $4,493 | $162,800 | $90,500 | $72,300 |
| 2018 | $4,981 | $162,800 | $90,500 | $72,300 |
| 2017 | $4,797 | $146,300 | $86,200 | $60,100 |
| 2016 | $4,196 | $146,300 | $86,200 | $60,100 |
| 2015 | $4,134 | $146,300 | $86,200 | $60,100 |
| 2014 | $4,038 | $146,300 | $86,200 | $60,100 |
Source: Public Records
Map
Nearby Homes
- 11 W Lake Shore Dr
- 11 Westwood Dr
- 54 Hall Passway
- 20 Maplewood Dr
- 5 Old Mill Plain Rd
- 55 Mill Plain Rd Unit 31-2
- 55 Mill Plain Rd Unit 17-6
- 55 Mill Plain Rd Unit 5-3
- 9 Wintergreen Hill Rd
- 1102 Larson Dr Unit 1102
- 3A Boyce Rd
- 2 Logans Way
- 6 Kenosia Ave Unit LOT 31
- 45 Winding Ridge Way Unit 45
- 7 Varian Dr
- 44 Boulevard Dr
- 6 Ken Oaks Dr
- 148 Middle River Rd
- 8 Country View Rd Unit 8
- 5 Gingham Ct Unit 5
- 8 Westwood Terrace
- 27 Westwood Dr
- 25 Westwood Dr
- 89 Driftway Rd
- 6 Westwood Terrace
- 4 Driftway Point Rd
- 23 Westwood Dr
- 9 Westwood Terrace
- 88 Driftway Rd
- 87 Driftway Rd Unit B
- 30 Westwood Dr
- 3 Driftway Point Rd
- 26 Westwood Dr
- 4 Westwood Terrace
- 5 Driftway Point Rd
- 28 Westwood Dr
- 4 W Lake Shore Dr
- 86 Driftway Rd
- 24 Westwood Dr
- 6 Driftway Point Rd