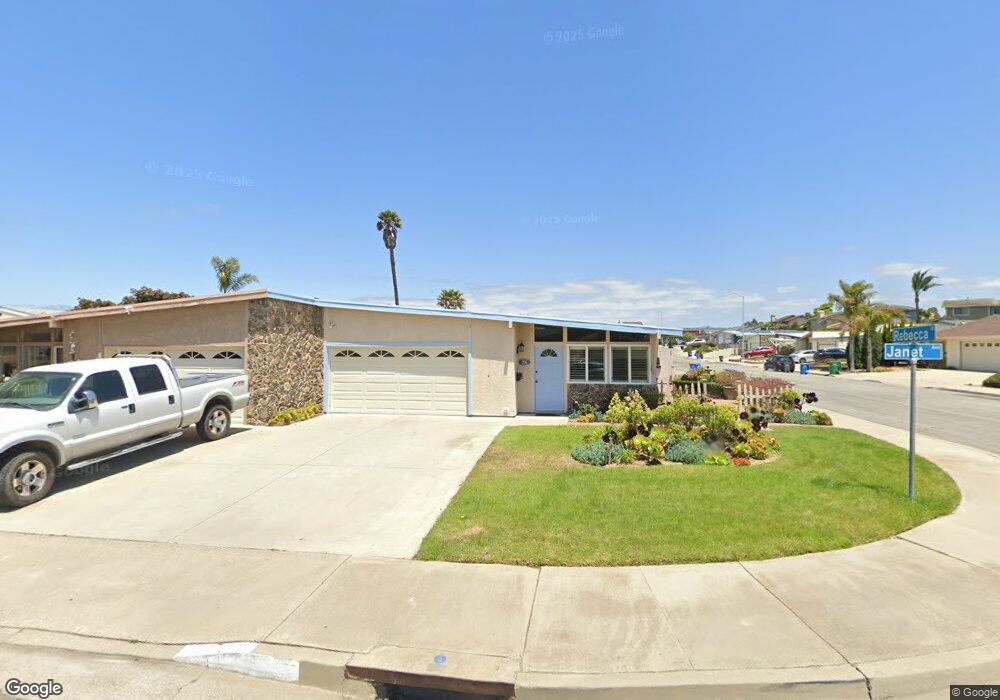
291 Janet Ave Grover Beach, CA 93433
Estimated Value: $601,000 - $798,000
2
Beds
2
Baths
1,288
Sq Ft
$514/Sq Ft
Est. Value
About This Home
This home is located at 291 Janet Ave, Grover Beach, CA 93433 and is currently estimated at $662,416, approximately $514 per square foot. 291 Janet Ave is a home located in San Luis Obispo County with nearby schools including Fairgrove Elementary School, Paulding Middle School, and Arroyo Grande High School.
Ownership History
Date
Name
Owned For
Owner Type
Purchase Details
Closed on
Sep 26, 2016
Sold by
Lloyd Jo Ann
Bought by
Lloyd Jo Ann
Current Estimated Value
Purchase Details
Closed on
Mar 10, 2010
Sold by
Krieger Kathryn
Bought by
Lloyd Joann
Home Financials for this Owner
Home Financials are based on the most recent Mortgage that was taken out on this home.
Original Mortgage
$215,200
Outstanding Balance
$142,416
Interest Rate
4.95%
Mortgage Type
New Conventional
Estimated Equity
$520,000
Purchase Details
Closed on
May 24, 2007
Sold by
Hale Jay C and Hale Anita M
Bought by
Krieger Lois A
Purchase Details
Closed on
May 3, 2005
Sold by
Hale Jay C and Hale Anita M
Bought by
Hale Jay C and Hale Anita M
Purchase Details
Closed on
Mar 30, 2000
Sold by
Mullahey Edward F
Bought by
Hale Jay C and Hale Anita N
Home Financials for this Owner
Home Financials are based on the most recent Mortgage that was taken out on this home.
Original Mortgage
$112,000
Interest Rate
8.25%
Create a Home Valuation Report for This Property
The Home Valuation Report is an in-depth analysis detailing your home's value as well as a comparison with similar homes in the area
Home Values in the Area
Average Home Value in this Area
Purchase History
| Date | Buyer | Sale Price | Title Company |
|---|---|---|---|
| Lloyd Jo Ann | -- | None Available | |
| Lloyd Joann | $269,000 | Fidelity National Title Co | |
| Krieger Lois A | $379,000 | Chicago Title Co | |
| Hale Jay C | -- | -- | |
| Hale Jay C | $140,000 | Fidelity National Title Co |
Source: Public Records
Mortgage History
| Date | Status | Borrower | Loan Amount |
|---|---|---|---|
| Open | Lloyd Joann | $215,200 | |
| Previous Owner | Hale Jay C | $112,000 |
Source: Public Records
Tax History Compared to Growth
Tax History
| Year | Tax Paid | Tax Assessment Tax Assessment Total Assessment is a certain percentage of the fair market value that is determined by local assessors to be the total taxable value of land and additions on the property. | Land | Improvement |
|---|---|---|---|---|
| 2025 | $3,282 | $299,456 | $154,892 | $144,564 |
| 2024 | $3,254 | $293,585 | $151,855 | $141,730 |
| 2023 | $3,254 | $287,829 | $148,878 | $138,951 |
| 2022 | $3,202 | $282,186 | $145,959 | $136,227 |
| 2021 | $3,163 | $276,654 | $143,098 | $133,556 |
| 2020 | $3,126 | $273,818 | $141,631 | $132,187 |
| 2019 | $3,099 | $268,450 | $138,854 | $129,596 |
| 2018 | $3,059 | $263,187 | $136,132 | $127,055 |
| 2017 | $2,922 | $258,027 | $133,463 | $124,564 |
| 2016 | $2,721 | $252,969 | $130,847 | $122,122 |
| 2015 | $2,658 | $249,170 | $128,882 | $120,288 |
| 2014 | $2,503 | $244,290 | $126,358 | $117,932 |
Source: Public Records
Map
Nearby Homes
- 155 Lynne St
- 1154 Marseille Ct
- 1207 Capitola St
- 1206 Capitola St
- 1180 Marbella Ct
- 1626 Monterey Ave
- 2201 La Verne St
- 1490 16th St
- 1241 Farroll Ave Unit 58
- 425 Bakeman Ln
- 1610 16th St
- 711 Paul Place
- 1659 Paso Robles St
- 1449 Ronald Way
- 1700 22nd St
- 575 Carmella Dr
- 1515 Nabal Ct
- 2120 Ocean St
- 2130 Ocean St
- 1681 Ocean St
- 281 Janet Ave
- 271 Janet Ave
- 100 Shanna Place
- 110 Shanna Place
- 261 Janet Ave
- 120 Shanna Place
- 118 Rebecca St
- 126 Rebecca St
- 112 Rebecca St
- 132 Rebecca St
- 130 Shanna Place
- 106 Rebecca St
- 251 Janet Ave
- 136 Rebecca St
- 100 Rebecca St
- 140 Shanna Place
- 241 Janet Ave
- 142 Rebecca St
- 150 Shanna Place
- 1920 Solana Ct