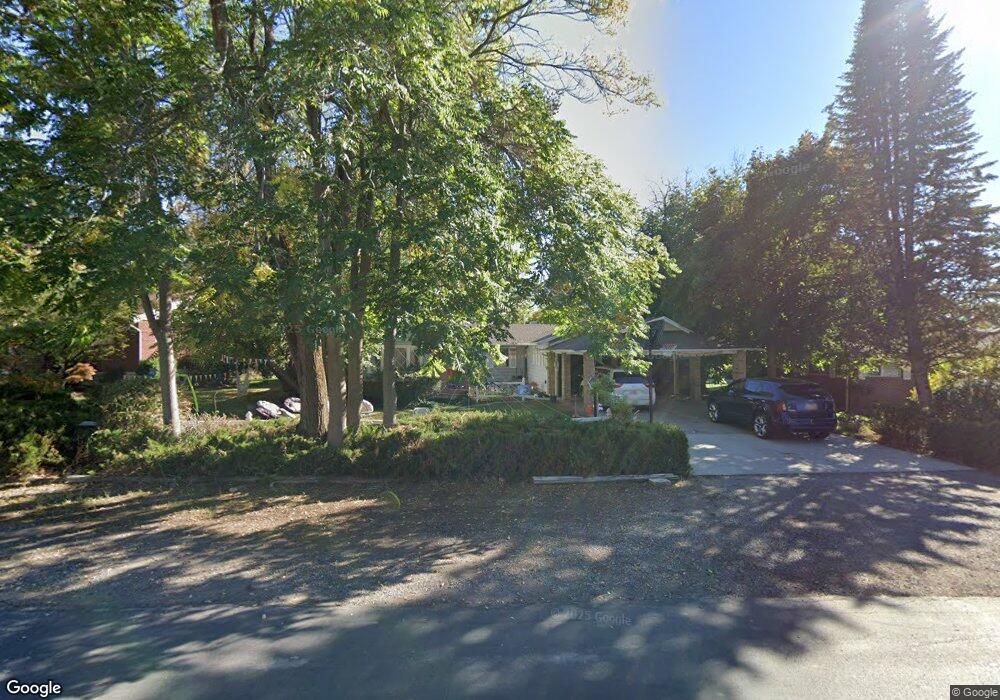
292 E 4075 N Provo, UT 84604
Rock Canyon NeighborhoodEstimated Value: $738,000 - $836,714
5
Beds
4
Baths
3,623
Sq Ft
$218/Sq Ft
Est. Value
About This Home
This home is located at 292 E 4075 N, Provo, UT 84604 and is currently estimated at $789,238, approximately $217 per square foot. 292 E 4075 N is a home located in Utah County with nearby schools including Canyon Crest Elementary School, Centennial Middle School, and Timpview High School.
Ownership History
Date
Name
Owned For
Owner Type
Purchase Details
Closed on
May 17, 2021
Sold by
Bingham Riley
Bought by
Holland Ashley and Holland Carl
Current Estimated Value
Home Financials for this Owner
Home Financials are based on the most recent Mortgage that was taken out on this home.
Original Mortgage
$522,500
Outstanding Balance
$473,515
Interest Rate
3.1%
Mortgage Type
New Conventional
Estimated Equity
$315,723
Purchase Details
Closed on
Nov 20, 2014
Sold by
Utah Alley Unversity Foundation Inc
Bought by
Bingham Riley
Home Financials for this Owner
Home Financials are based on the most recent Mortgage that was taken out on this home.
Original Mortgage
$280,700
Interest Rate
3.89%
Mortgage Type
New Conventional
Purchase Details
Closed on
Aug 13, 2013
Sold by
Brewster Wilma and Ogden Pam
Bought by
Utah Valley University Foundation Inc
Purchase Details
Closed on
Aug 10, 2011
Sold by
Crouch Donna Beth
Bought by
Crouch Donna Beth
Create a Home Valuation Report for This Property
The Home Valuation Report is an in-depth analysis detailing your home's value as well as a comparison with similar homes in the area
Home Values in the Area
Average Home Value in this Area
Purchase History
| Date | Buyer | Sale Price | Title Company |
|---|---|---|---|
| Holland Ashley | -- | Vanguard Title Ins Agency | |
| Bingham Riley | -- | Fidelity Land & Title | |
| Utah Valley University Foundation Inc | -- | None Available | |
| Crouch Donna Beth | -- | None Available |
Source: Public Records
Mortgage History
| Date | Status | Borrower | Loan Amount |
|---|---|---|---|
| Open | Holland Ashley | $522,500 | |
| Previous Owner | Bingham Riley | $280,700 |
Source: Public Records
Tax History
| Year | Tax Paid | Tax Assessment Tax Assessment Total Assessment is a certain percentage of the fair market value that is determined by local assessors to be the total taxable value of land and additions on the property. | Land | Improvement |
|---|---|---|---|---|
| 2025 | $4,208 | $399,795 | -- | -- |
| 2024 | $4,208 | $414,260 | $0 | $0 |
| 2023 | $4,153 | $403,040 | $0 | $0 |
| 2022 | $3,986 | $390,060 | $0 | $0 |
| 2021 | $3,038 | $518,500 | $226,600 | $291,900 |
| 2020 | $2,969 | $475,000 | $188,800 | $286,200 |
| 2019 | $2,631 | $437,700 | $188,800 | $248,900 |
| 2018 | $2,458 | $414,700 | $176,800 | $237,900 |
| 2017 | $2,316 | $214,775 | $0 | $0 |
| 2016 | $2,646 | $228,635 | $0 | $0 |
| 2015 | $2,551 | $222,860 | $0 | $0 |
| 2014 | $2,351 | $214,060 | $0 | $0 |
Source: Public Records
Map
Nearby Homes
- 299 E 4000 N
- 407 E 3900 Rd N Unit 1
- 407 E 3900 Rd N
- 3711 N Canyon Rd
- 645 Foothill Dr
- 4380 Stone Creek Ln
- 5600 N Canyon Rd
- 4601 Foothill Dr
- 285 Three Fountains Dr
- 3702 N 920 E
- 981 Waterford Dr Unit 5&6
- 221 E 4735 N
- 4606 Brookshire Cir
- 404 W 3700 N
- 4299 Ivy Ln
- 4640 Brookshire Cir
- 158 Woodside Dr
- 3305 N Shadowbrook Cir
- 111 Candlewood Place
- 3221 Shadowbrook Cir
Your Personal Tour Guide
Ask me questions while you tour the home.