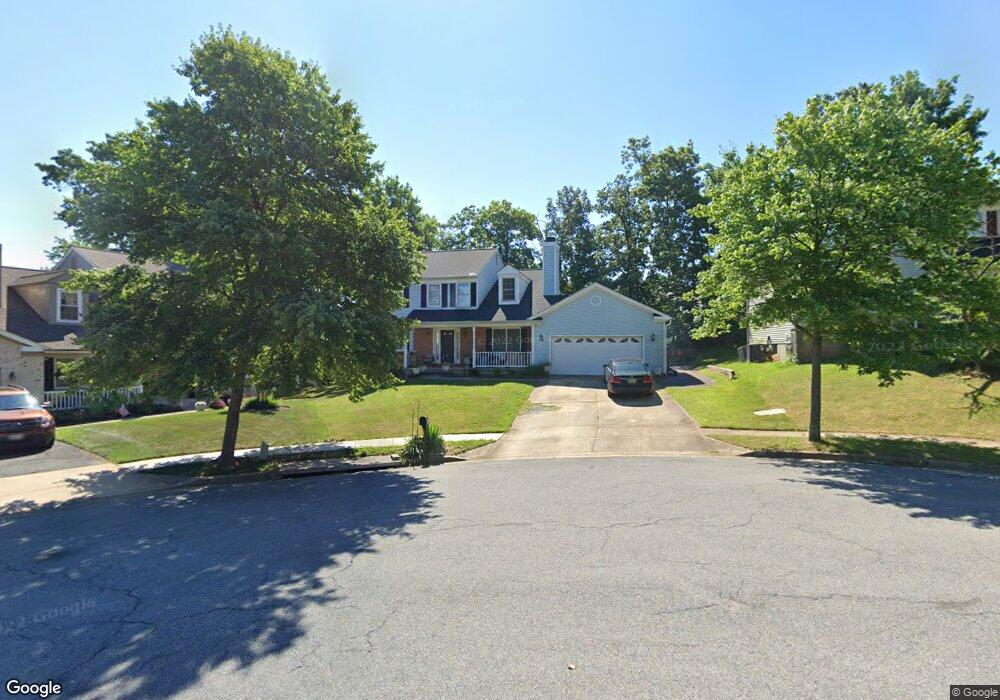
2921 Cheverly Oak Ct Cheverly, MD 20785
Estimated Value: $462,000 - $594,000
--
Bed
2
Baths
2,096
Sq Ft
$253/Sq Ft
Est. Value
About This Home
This home is located at 2921 Cheverly Oak Ct, Cheverly, MD 20785 and is currently estimated at $530,874, approximately $253 per square foot. 2921 Cheverly Oak Ct is a home located in Prince George's County with nearby schools including Gladys Noon Spellman Elementary School, G. James Gholson Middle School, and Bladensburg High School.
Ownership History
Date
Name
Owned For
Owner Type
Purchase Details
Closed on
May 24, 2021
Sold by
Adade Aaron Y B and Buadoo Adade Felicia
Bought by
Buadoo Adade Felicia D
Current Estimated Value
Home Financials for this Owner
Home Financials are based on the most recent Mortgage that was taken out on this home.
Original Mortgage
$313,000
Outstanding Balance
$232,360
Interest Rate
2.8%
Mortgage Type
New Conventional
Estimated Equity
$298,514
Purchase Details
Closed on
Nov 23, 2005
Sold by
Adade Aaron Y B and Adade Felicia B
Bought by
Adade Aaron Y B and Adade Felicia D
Purchase Details
Closed on
Jul 28, 2005
Sold by
Adade Aaron Y B and Adade Felicia B
Bought by
Adade Aaron Y B and Adade Felicia D
Purchase Details
Closed on
Apr 28, 1994
Sold by
Cheverly Oaks Partnership
Bought by
Abade Aaron Y
Home Financials for this Owner
Home Financials are based on the most recent Mortgage that was taken out on this home.
Original Mortgage
$182,700
Interest Rate
7.7%
Create a Home Valuation Report for This Property
The Home Valuation Report is an in-depth analysis detailing your home's value as well as a comparison with similar homes in the area
Home Values in the Area
Average Home Value in this Area
Purchase History
| Date | Buyer | Sale Price | Title Company |
|---|---|---|---|
| Buadoo Adade Felicia D | -- | Accommodation | |
| Adade Aaron Y B | -- | -- | |
| Adade Aaron Y B | -- | -- | |
| Abade Aaron Y | $203,000 | -- |
Source: Public Records
Mortgage History
| Date | Status | Borrower | Loan Amount |
|---|---|---|---|
| Open | Buadoo Adade Felicia D | $313,000 | |
| Previous Owner | Abade Aaron Y | $182,700 |
Source: Public Records
Tax History Compared to Growth
Tax History
| Year | Tax Paid | Tax Assessment Tax Assessment Total Assessment is a certain percentage of the fair market value that is determined by local assessors to be the total taxable value of land and additions on the property. | Land | Improvement |
|---|---|---|---|---|
| 2025 | $8,279 | $519,533 | -- | -- |
| 2024 | $8,279 | $477,067 | $0 | $0 |
| 2023 | $7,473 | $434,600 | $100,800 | $333,800 |
| 2022 | $6,934 | $418,267 | $0 | $0 |
| 2021 | $6,624 | $401,933 | $0 | $0 |
| 2020 | $13,026 | $385,600 | $100,400 | $285,200 |
| 2019 | $6,923 | $383,133 | $0 | $0 |
| 2018 | $5,620 | $380,667 | $0 | $0 |
| 2017 | $6,191 | $378,200 | $0 | $0 |
| 2016 | -- | $349,667 | $0 | $0 |
| 2015 | -- | $321,133 | $0 | $0 |
| 2014 | $6,579 | $292,600 | $0 | $0 |
Source: Public Records
Map
Nearby Homes
- 6327 Joslyn Place
- 3204 Cheverly Hills Ct
- 6502 Maureen Ct
- 2804 Woodway Place
- 2817 63rd Place
- 6431 Forest Rd
- 2813 Laurel Ave
- 3418 63rd Ave
- 3610 64th Ave
- 6204 Lombard St
- 2512 Wayne Place
- 3708 Cooper Ln
- 6017 Inwood St
- 3301 Belleview Ave
- 6011 Kilmer St
- 3732 Ingalls Ave
- 6013 Hawthorne St
- 2804 Belleview Ave
- 3832 Devil Tree Ct
- 3408 Cheverly Ave
- 2923 Cheverly Oak Ct
- 2919 Cheverly Oak Ct
- 3102 Hillside Ave
- 3008 Hillside Ave
- 3104 Hillside Ave
- 2917 Cheverly Oak Ct
- 6507 Oak Forest Ct
- 6505 Oak Forest Ct
- 2922 Cheverly Oak Ct
- 3006 Hillside Ave
- 2920 Cheverly Oak Ct
- 2918 Cheverly Oak Ct
- 3106 Hillside Ave
- 6503 Oak Forest Ct
- 2915 Cheverly Oak Ct
- 6500 Cedar St
- 3004 Hillside Ave
- 2916 Cheverly Oak Ct
- 3103 Hillside Ave
- 6501 Oak Forest Ct