
Seller's Agent in 2025
Brian Ferguson
Suite One Real Estate Services
(805) 238-3055
4 in this area
51 Total Sales
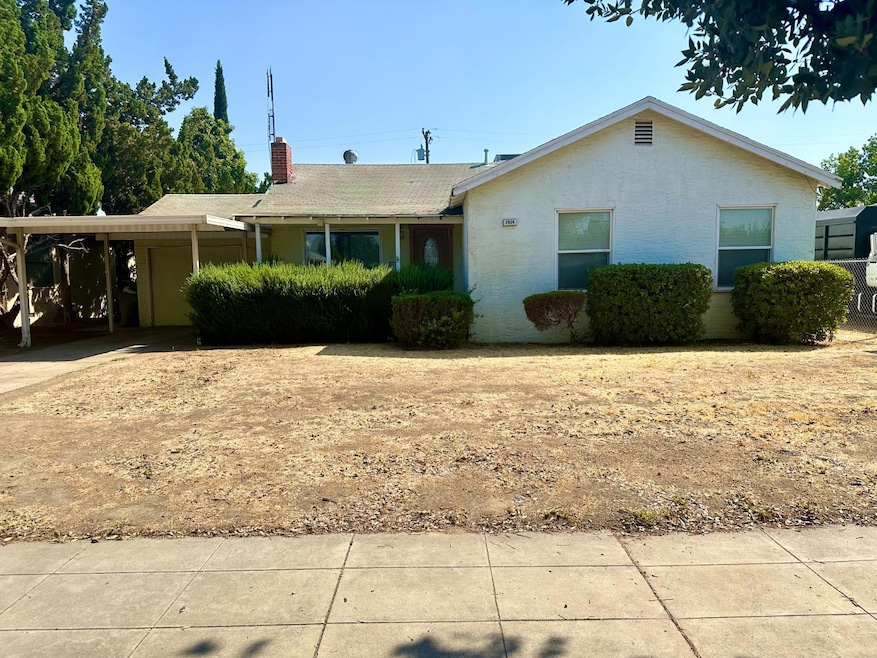
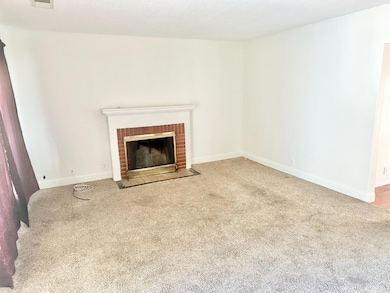
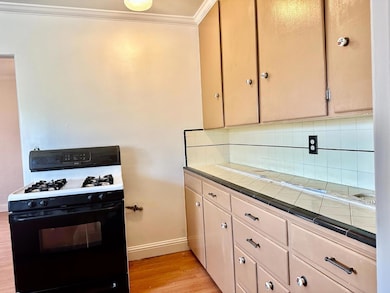
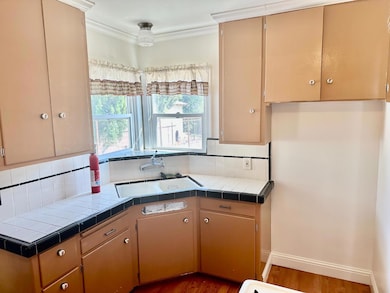
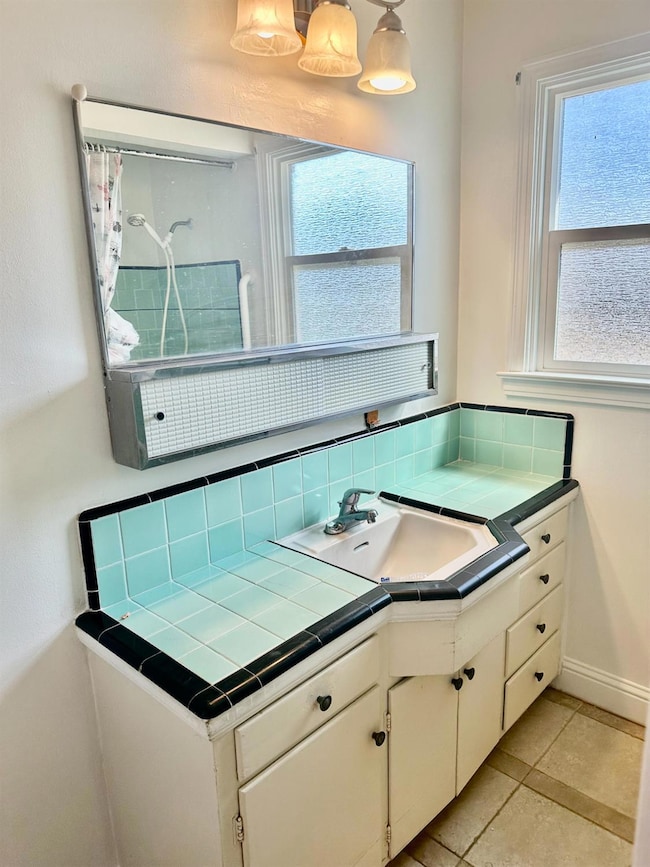
3-bedroom 1-bath cottage with spacious back yard. Property includes covered carport, attached garage, central ac, and wood burning fireplace. Home is located on quiet, family friendly neighborhood near Tower District and Fresno City College.
Last Agent to Sell the Property
Suite One Real Estate Services License #01907765 Listed on: 10/11/2025
Last Buyer's Agent
Candido Reynoso Patlan
Western Pioneer Properties License #02139886
| Date | Type | Sale Price | Title Company |
|---|---|---|---|
| Grant Deed | $300,000 | Chicago Title | |
| Grant Deed | -- | None Listed On Document | |
| Grant Deed | $206,500 | Chicago Title | |
| Deed | -- | Chicago Title | |
| Grant Deed | $57,500 | None Available | |
| Interfamily Deed Transfer | -- | -- |
| Date | Status | Loan Amount | Loan Type |
|---|---|---|---|
| Open | $294,566 | FHA | |
| Previous Owner | $230,000 | Construction |
| Date | Event | Price | List to Sale | Price per Sq Ft |
|---|---|---|---|---|
| 12/12/2025 12/12/25 | Sold | $300,000 | +1.7% | $238 / Sq Ft |
| 10/28/2025 10/28/25 | Pending | -- | -- | -- |
| 10/11/2025 10/11/25 | For Sale | $295,000 | -- | $234 / Sq Ft |
| Year | Tax Paid | Tax Assessment Tax Assessment Total Assessment is a certain percentage of the fair market value that is determined by local assessors to be the total taxable value of land and additions on the property. | Land | Improvement |
|---|---|---|---|---|
| 2025 | $4,175 | $321,300 | $71,400 | $249,900 |
| 2023 | $1,232 | $95,170 | $25,347 | $69,823 |
| 2022 | $1,216 | $93,304 | $24,850 | $68,454 |
| 2021 | $1,183 | $91,475 | $24,363 | $67,112 |
| 2020 | $1,178 | $90,538 | $24,114 | $66,424 |
| 2019 | $1,133 | $88,764 | $23,642 | $65,122 |
| 2018 | $1,109 | $87,025 | $23,179 | $63,846 |
| 2017 | $1,090 | $85,320 | $22,725 | $62,595 |
| 2016 | $1,054 | $83,648 | $22,280 | $61,368 |
| 2015 | $660 | $51,653 | $9,391 | $42,262 |
| 2014 | $646 | $50,643 | $9,208 | $41,435 |
Seller's Agent in 2025
Brian Ferguson
Suite One Real Estate Services
(805) 238-3055
4 in this area
51 Total Sales
C
Buyer's Agent in 2025
Candido Reynoso Patlan
Western Pioneer Properties
Source: Fresno MLS
MLS Number: 638396
APN: 445-131-03
Disclaimer: Certain information contained herein is derived from information provided by parties other than Homes.com. All information provided is deemed reliable, but is not guaranteed to be accurate and should be independently verified.
![]() IDX information is provided exclusively for personal, non-commercial use, and may not be used for any purpose other than to identify prospective properties consumers may be interested in purchasing. Information is deemed reliable but not guaranteed.
IDX information is provided exclusively for personal, non-commercial use, and may not be used for any purpose other than to identify prospective properties consumers may be interested in purchasing. Information is deemed reliable but not guaranteed.
Ask me questions while you tour the home.