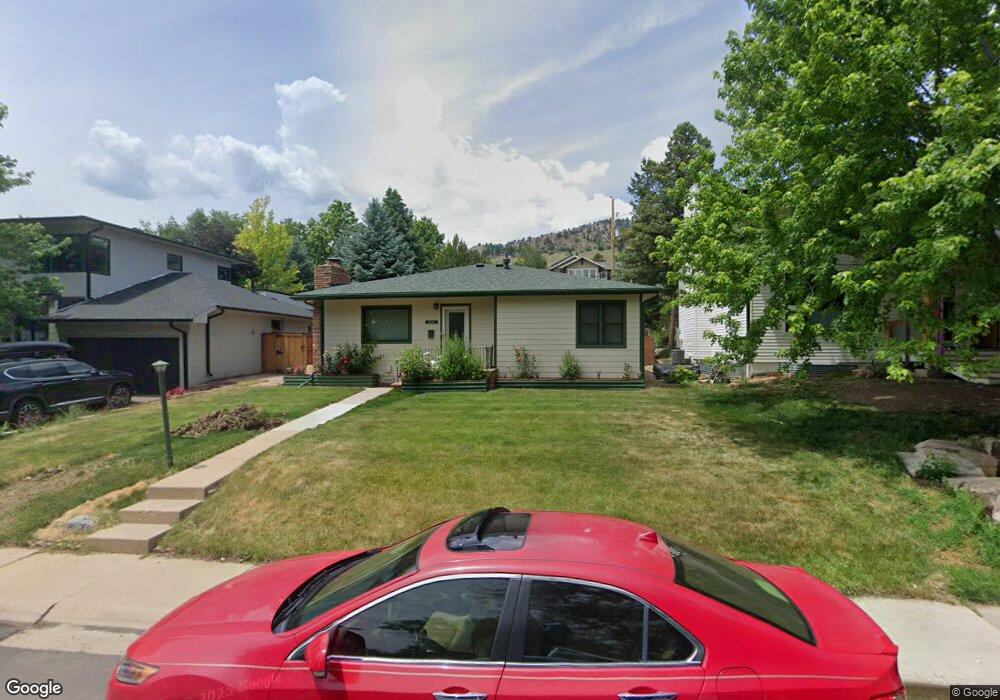
2941 7th St Boulder, CO 80304
Newlands NeighborhoodEstimated Value: $1,425,000 - $2,106,000
3
Beds
2
Baths
2,101
Sq Ft
$846/Sq Ft
Est. Value
About This Home
This home is located at 2941 7th St, Boulder, CO 80304 and is currently estimated at $1,777,570, approximately $846 per square foot. 2941 7th St is a home located in Boulder County with nearby schools including Foothill Elementary School, Casey Middle School, and Boulder High School.
Ownership History
Date
Name
Owned For
Owner Type
Purchase Details
Closed on
Aug 20, 2020
Sold by
Swan Jaclyn B and Swan Philip L
Bought by
The Philip L And Jaclyn B Swan Trust
Current Estimated Value
Purchase Details
Closed on
Sep 25, 2012
Sold by
Swan Jaclyn B
Bought by
Swan Jaclyn B
Purchase Details
Closed on
Mar 14, 2006
Sold by
Swan Jaclyn B and Swan Philip L
Bought by
Swan Jaclyn B
Purchase Details
Closed on
Nov 22, 1995
Sold by
Swan Jaclyn B
Bought by
Swan Jaclyn B
Home Financials for this Owner
Home Financials are based on the most recent Mortgage that was taken out on this home.
Original Mortgage
$93,000
Outstanding Balance
$1,271
Interest Rate
7.36%
Estimated Equity
$1,776,299
Purchase Details
Closed on
Dec 29, 1994
Sold by
Swan Philip L and Swan Jaclyn B
Bought by
Swan Jaclyn B
Purchase Details
Closed on
Dec 4, 1985
Bought by
Swan Jaclyn B and Swan Philip L
Purchase Details
Closed on
Jun 25, 1968
Bought by
Swan Jaclyn B and Swan Philip L
Create a Home Valuation Report for This Property
The Home Valuation Report is an in-depth analysis detailing your home's value as well as a comparison with similar homes in the area
Home Values in the Area
Average Home Value in this Area
Purchase History
| Date | Buyer | Sale Price | Title Company |
|---|---|---|---|
| The Philip L And Jaclyn B Swan Trust | -- | None Available | |
| Swan Jaclyn B | -- | None Available | |
| Swan Jaclyn B | -- | None Available | |
| Swan Jaclyn B | -- | -- | |
| Swan Jaclyn B | -- | -- | |
| Swan Jaclyn B | $110,000 | -- | |
| Swan Jaclyn B | $16,300 | -- |
Source: Public Records
Mortgage History
| Date | Status | Borrower | Loan Amount |
|---|---|---|---|
| Open | Swan Jaclyn B | $93,000 |
Source: Public Records
Tax History
| Year | Tax Paid | Tax Assessment Tax Assessment Total Assessment is a certain percentage of the fair market value that is determined by local assessors to be the total taxable value of land and additions on the property. | Land | Improvement |
|---|---|---|---|---|
| 2025 | $8,086 | $90,019 | $81,017 | $9,002 |
| 2024 | $8,086 | $90,019 | $81,017 | $9,002 |
| 2023 | $7,945 | $98,704 | $92,150 | $10,239 |
| 2022 | $6,446 | $76,367 | $67,200 | $9,167 |
| 2021 | $6,147 | $78,564 | $69,133 | $9,431 |
| 2020 | $5,009 | $64,700 | $51,766 | $12,934 |
| 2019 | $4,933 | $64,700 | $51,766 | $12,934 |
| 2018 | $4,331 | $57,154 | $45,720 | $11,434 |
| 2017 | $4,195 | $63,186 | $50,546 | $12,640 |
| 2016 | $4,083 | $55,123 | $40,835 | $14,288 |
| 2015 | $3,866 | $45,618 | $19,820 | $25,798 |
| 2014 | $3,836 | $45,618 | $19,820 | $25,798 |
Source: Public Records
Map
Nearby Homes
- 2958 6th St
- 3056 8th St
- 501 Evergreen Ave
- 515 Alpine Ave
- 815 Alpine Ave Unit 2
- 3150 5th St
- 3015 3rd St
- 3033 3rd St
- 3189 5th St
- 3086 11th St
- 2675 Dakota Place Unit Newlands
- 3135 11th St
- 653 Dewey Ave
- 300 Forest Ave
- 534 Dewey Ave
- 1201 Balsam Ave Unit 206
- 1237 Elder Ave Unit 1
- 1023 Forest Ave
- 1009 Portland Place
- 3231 11th St
Your Personal Tour Guide
Ask me questions while you tour the home.