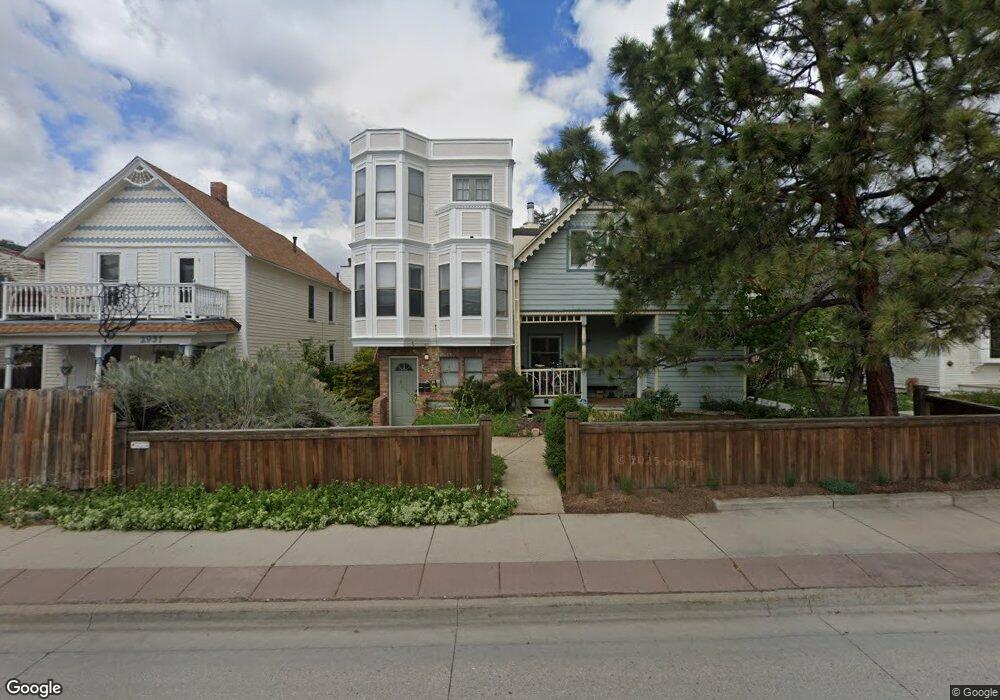
2943 Broadway St Unit A Boulder, CO 80304
Newlands NeighborhoodEstimated Value: $650,000 - $957,000
3
Beds
3
Baths
1,728
Sq Ft
$451/Sq Ft
Est. Value
About This Home
This home is located at 2943 Broadway St Unit A, Boulder, CO 80304 and is currently estimated at $780,170, approximately $451 per square foot. 2943 Broadway St Unit A is a home located in Boulder County with nearby schools including Foothill Elementary School, Casey Middle School, and Boulder High School.
Ownership History
Date
Name
Owned For
Owner Type
Purchase Details
Closed on
Feb 28, 2001
Sold by
Kenny Claran P and Henegen Stefania A
Bought by
Kenny Stefanie A and Kenny Claran P
Current Estimated Value
Home Financials for this Owner
Home Financials are based on the most recent Mortgage that was taken out on this home.
Original Mortgage
$216,000
Outstanding Balance
$79,122
Interest Rate
7.1%
Estimated Equity
$701,048
Purchase Details
Closed on
Dec 27, 1999
Sold by
Hooper Craig H
Bought by
Kenny Ciaran P and Henegen Stefanie A
Home Financials for this Owner
Home Financials are based on the most recent Mortgage that was taken out on this home.
Original Mortgage
$223,450
Interest Rate
8%
Purchase Details
Closed on
Oct 13, 1993
Sold by
Gibbs Barbara Ann
Bought by
Hooper Craig H
Purchase Details
Closed on
Nov 3, 1989
Bought by
Kenny Ciaran P and Kenny Stefanie A
Create a Home Valuation Report for This Property
The Home Valuation Report is an in-depth analysis detailing your home's value as well as a comparison with similar homes in the area
Home Values in the Area
Average Home Value in this Area
Purchase History
| Date | Buyer | Sale Price | Title Company |
|---|---|---|---|
| Kenny Stefanie A | -- | Frontier Title Llc | |
| Kenny Ciaran P | $235,250 | -- | |
| Hooper Craig H | $130,800 | -- | |
| Kenny Ciaran P | $63,000 | -- |
Source: Public Records
Mortgage History
| Date | Status | Borrower | Loan Amount |
|---|---|---|---|
| Open | Kenny Stefanie A | $216,000 | |
| Closed | Kenny Ciaran P | $223,450 |
Source: Public Records
Tax History Compared to Growth
Tax History
| Year | Tax Paid | Tax Assessment Tax Assessment Total Assessment is a certain percentage of the fair market value that is determined by local assessors to be the total taxable value of land and additions on the property. | Land | Improvement |
|---|---|---|---|---|
| 2025 | $3,786 | $46,281 | -- | $46,281 |
| 2024 | $3,786 | $46,281 | -- | $46,281 |
| 2023 | $3,718 | $42,183 | -- | $45,868 |
| 2022 | $4,098 | $43,326 | $0 | $43,326 |
| 2021 | $3,912 | $44,573 | $0 | $44,573 |
| 2020 | $3,642 | $41,842 | $0 | $41,842 |
| 2019 | $3,586 | $41,842 | $0 | $41,842 |
| 2018 | $3,064 | $35,338 | $0 | $35,338 |
| 2017 | $2,968 | $39,068 | $0 | $39,068 |
| 2016 | $2,758 | $31,864 | $0 | $31,864 |
| 2015 | $2,612 | $24,883 | $0 | $24,883 |
| 2014 | $2,092 | $24,883 | $0 | $24,883 |
Source: Public Records
Map
Nearby Homes
- 2930 Broadway St Unit B101
- 3000 Broadway St Unit 10
- 3000 Broadway St Unit 10 & 11
- 2917 13th St
- 3025 Broadway St Unit 7
- 1201 Balsam Ave Unit 203
- 1201 Balsam Ave Unit 201
- 1241 Balsam Ave
- 1237 Elder Ave Unit 1
- 1265 Balsam Ave
- 1267 Balsam Ave
- 780 Alpine Ave
- 3135 11th St
- 1303 Alpine Ave Unit 24A
- 3056 8th St
- 815 Alpine Ave Unit 2
- 3010 14th St
- 3080 7th St
- 1023 Forest Ave
- 2958 6th St
- 2945 Broadway St Unit C
- 2947 Broadway St Unit B
- 2937 Broadway St Unit 2
- 2937 Broadway St Unit 1
- 2949 Broadway St
- 2949 Broadway St Unit 1
- 2935 Broadway St Unit 1
- 2935 Broadway St
- 0 Downtown St Unit 571955
- 2961 Broadway St
- 2931 Broadway St Unit A & B
- 2931 Broadway St
- 2956 11th St
- 2938 11th St
- 2962 11th St
- 2927 Broadway St
- 2950 Broadway St Unit 10
- 2950 Broadway St Unit 9
- 2950 Broadway St Unit 8
- 2950 Broadway St Unit 7